“The results of three separate studies seem to show that… the sun could be heading into a more-dormant period, with activity during the next 11-year sunspot cycle greatly reduced or even eliminated”…
Sun’s Fading Spots Signal Big Drop in Solar Activity
by Denise Chow, SPACE.com Staff Writer
Date: 14 June 2011Some unusual solar readings, including fading sunspots and weakening magnetic activity near the poles, could be indications that our sun is preparing to be less active in the coming years.
[…]
The results of the new studies were announced today (June 14) at the annual meeting of the solar physics division of the American Astronomical Society, which is being held this week at New Mexico State University in Las Cruces.
[…]
Currently, the sun is in the midst of the period designated as Cycle 24 and is ramping up toward the cycle’s period of maximum activity. However, the recent findings indicate that the activity in the next 11-year solar cycle, Cycle 25, could be greatly reduced. In fact, some scientists are questioning whether this drop in activity could lead to a second Maunder Minimum, which was a 70-year period from 1645 to 1715 when the sun showed virtually no sunspots.
[…]
“If we are right, this could be the last solar maximum we’ll see for a few decades,” Hill said. “That would affect everything from space exploration to Earth’s climate.”
Space.com
A recent paper in the journal, Astronomy & Astrophysics demonstrated that solar forcing is actually six time greater than that cited by the IPCC…
New solar reconstruction paper suggests 6x greater solar forcing change than cited by the IPCC
Posted on May 10, 2011 by Anthony Watts
This is interesting. This recent paper published in the journal Astronomy & Astrophysics here has done a reconstruction of TSI using Beryllium 10 isotope records combined with sunspot records. The paper suggests that the Total Solar Irradiance (TSI) has increased since the end of the Little Ice Age (around 1850) by up to 6 x more than cited by the IPCC.
Modulation potential (lower panel) and TSI reconstructions (upper panel) for the last 2500 years. Data prior to 1600 AD are based on the modulation potential derived from 10Be records from the Greenland Ice core Project (red curves). Data since 1600 AD are based on the two composites shown in Fig. 1 (red and cyan curves). The grey-shaded area indicates the intrinsic uncertainty.

The estimated direct radiative forcing due to changes in the solar output since 1750 is +0.12 [+0.06 to +0.3] W m–2, which is less than half of the estimate given in the TAR, with a low level of scientific understanding.
“The paper suggests that the Total Solar Irradiance (TSI) has increased since the end of the Little Ice Age (around 1850) by up to 6 x more than cited by the IPCC.”
6 X 0.12 = 0.72
What happens if we shift 0.6 wm-2 from anthropogenic forcing to natural forcing?
This happens…

IPCC vs Shapiro et al., 2011
This makes the natural and anthropogenic forcing about equal… It also shows that the error bar of the anthropogenic forcing is larger than the forcing. Bear in mind that the IPCC also does not realize that most of the CO2 rise since 1700 is the result of oceanic outgassing associated with the warm-up from the Little Ice Age. So the potential anthropogenic forcing is more like 1/4 (or less) of the total forcing.
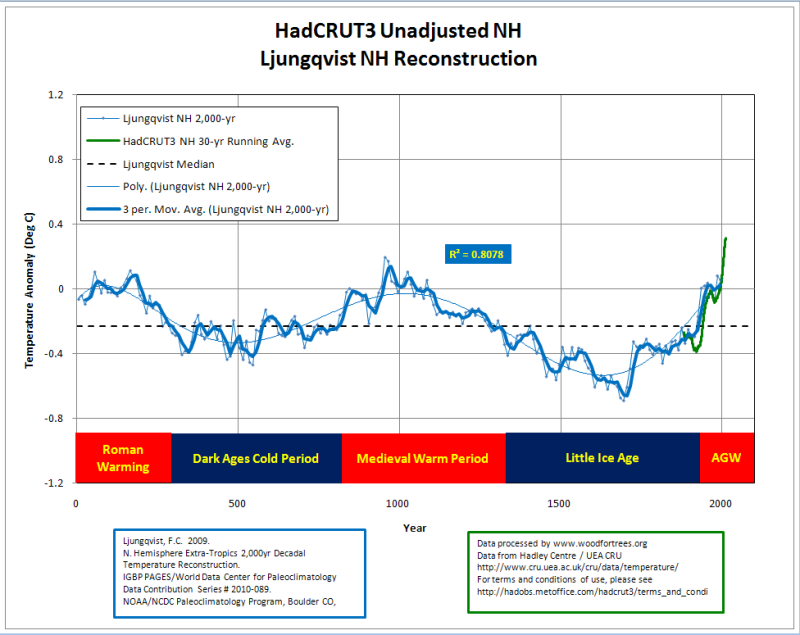
The Shapiro et al., 2011 TSI reconstruction correlates quite well with Ljungqvist’s 2010 Northern Hemisphere climate reconstruction…
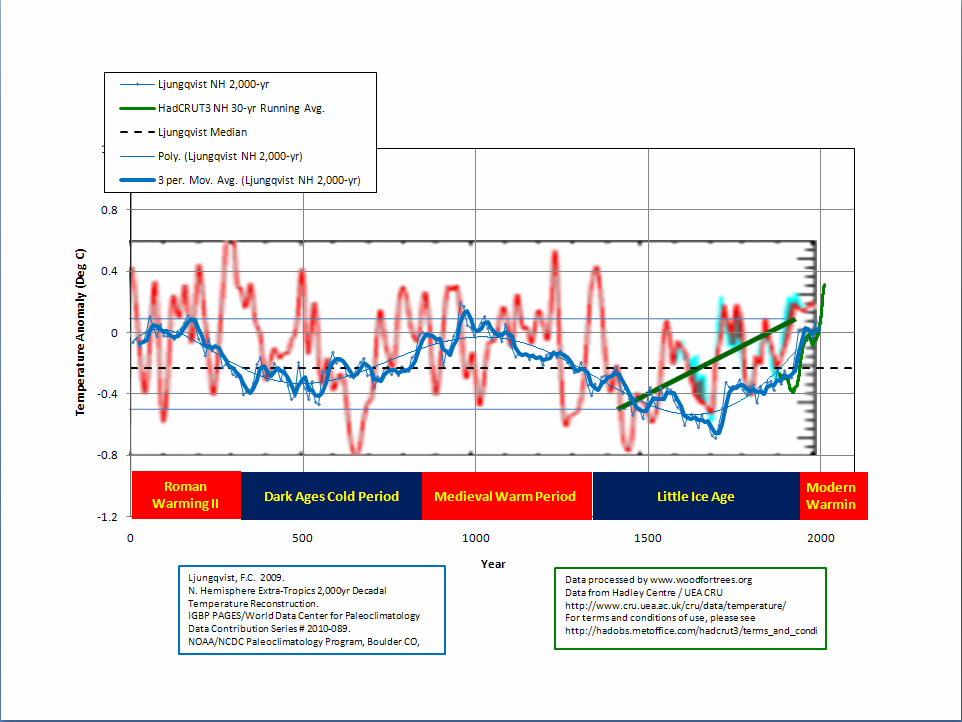
Shapiro et al., 2011 TSI and Ljungqvist 2010 climate reconstructions.
Note that the sharp solar minima in ca. 700 AD and ca. 1400 AD were associated with the Dark Ages Cold Period and Little Ice Age. This fits in quite well with the overwhelming evidence of a Holocene millennial-scale climate cycle. It would also suggest that the mild climate conditions of the Modern Warming will begin to deteriorate by the end of the 21st century.
Looks like the return to “Little Ice Age” conditions might come sooner rather than later…


March 2, 2012 at 15:15 |
[…] times greater than the instrumental data suggest. Funny thing: recent papers have concluded that solar forcing has been underestimated by a factor of six and CO2 forcing is much lower than the so-called consensus […]
March 3, 2012 at 17:00 |
[…] times greater than the instrumental data suggest. Funny thing: recent papers have concluded that solar forcing has been underestimated by a factor of six and CO2 forcing is much lower than the so-called consensus […]
March 4, 2012 at 13:46 |
“So the potential anthropogenic forcing is more like 1/4 (or less) of the total forcing.”
It is generally accepted that only less than 5% of the increase of CO2 is due to humans, one-twentieth of 0.6C= 0.03C/century is anthropogenic.
December 14, 2013 at 09:14 |
[…] possible ECS, consistent with the observations, is 1.0°C. Recent papers have concluded that solar forcing has been underestimated by a factor of six and CO2 forcing is much lower than the so-called consensus […]
December 14, 2013 at 11:50 |
[…] ECS, consistent with the observations, is about 1.0°C. Recent papers have concluded that solar forcing has been underestimated by a factor of six and CO2 forcing is much lower than the so-called consensus estimate. […]