Observations from the geological record show that atmospheric CO2 concentrations are now at their highest levels in at least the past 3 million years.
Maybe even 12 million years…
Figure 1. Neogene-Quaternary temperature and carbon dioxide (older is toward the left).
This passage from Evolution of the Earth (1976) is just as true today as when we were geology students way back in the Pleistocene…
Unfortunately we cannot estimate accurately changes of past CO2 content of either atmosphere or oceans, nor is there any firm quantitative basis for estimating the the magnitude of drop in carbon dioxide content necessary to trigger glaciation. Moreover the entire concept of an atmospheric greenhouse effect is controversial, for the rate of ocean-atmosphere equalization is uncertain.
Dott & Batten, 1976
While methods of estimating past atmospheric CO2 concentrations have improved since the 1970’s, we can’t even be certain that the atmospheric concentration of CO2 during the much warmer Mid-Miocene Climatic Optimum was significantly elevated relative to the extremely low values of the Quaternary Period.
Furthermore, the current speed of human-induced CO2 change and warming is nearly without precedent in the entire geological record, with the only known exception being the instantaneous, meteorite-induced event that caused the extinction of non-bird-like dinosaurs 66 million years ago.
While this is certainly possible, there are no geological records of CO2 change that have sufficient resolution to make this claim with any degree of certainty. The only exception would be the Law Dome ice cores in Antarctica, which only go back about 2,000 years.
This composite ice core CO2 record (0-800 kyr BP) from Bereiter et al. (2014) appears to present a very convincing Hockey Stick.
Figure 2. Composite CO2 record (0-800 kyr BP) from Bereiter et al. (2014).
This is a composite of the following ice cores:
-51-1800 yr BP:’
Law Dome (Rubino et al., 2013)
1.8-2 kyr BP:
Law Dome (MacFarling Meure et al., 2006)
2-11 kyr BP:
Dome C (Monnin et al., 2001 + 2004)
11-22 kyr BP:
WAIS (Marcott et al., 2014) minus 4 ppmv (see text)
22-40 kyr BP:
Siple Dome (Ahn et al., 2014)
40-60 kyr BP:
TALDICE (Bereiter et al., 2012)
60-115 kyr BP:
EDML (Bereiter et al., 2012)
105-155 kyr BP:
Dome C Sublimation (Schneider et al., 2013)
155-393 kyr BP:
Vostok (Petit et al., 1999)
393-611 kyr BP:
Dome C (Siegenthaler et al., 2005)
612-800 kyr BP:
Dome C (Bereiter et al., 2014)
These ice cores are of vastly different resolutions. Petit et al., 1999 indicate that the CO2 resolution for Vostok is 1,500 years. Lüthi et al., 2008 suggest a CO2 resolution of about 500 years for Dome C. It appears that the high resolution Law Dome DE08 core was just spliced on to the lower frequency older ice cores.
If I apply smoothing filters to the DE08 ice core in order to match the resolution of the lower resolution ice cores, I get a considerably different picture.
Figure 3. A 500-yr smoothing filter totally removes the Hockey Stick’s blade.
The lower frequency ice cores are not capable of resolving century scale CO2 shifts. As such, they cannot be used to rule out the possibility of short duration fluctuations comparable to the industrial era rise in atmospheric CO2 during the early Holocene and Pleistocene. And thus do not contradict the conclusions of Wagner et al., 1999:
In contrast to conventional ice core estimates of 270 to 280 parts per million by volume (ppmv), the stomatal frequency signal suggests that early Holocene carbon dioxide concentrations were well above 300 ppmv.
[…]
Most of the Holocene ice core records from Antarctica do not have adequate temporal resolution.
[…]
Our results falsify the concept of relatively stabilized Holocene CO2 concentrations of 270 to 280 ppmv until the industrial revolution. SI-based CO2 reconstructions may even suggest that, during the early Holocene, atmospheric CO2 concentrations that were 300 ppmv could have been the rule rather than the exception.
Wagner et al., 1999
Or Wagner et al., 2004:
The majority of the stomatal frequency-based estimates of CO2 for the Holocene do not support the widely accepted concept of comparably stable CO2 concentrations throughout the past 11,500 years. To address the critique that these stomatal frequency variations result from local environmental change or methodological insufficiencies, multiple stomatal frequency records were compared for three climatic key periods during the Holocene, namely the Preboreal oscillation, the 8.2 kyr cooling event and the Little Ice Age. The highly comparable fluctuations in the paleo-atmospheric CO2 records, which were obtained from different continents and plant species (deciduous angiosperms as well as conifers) using varying calibration approaches, provide strong evidence for the integrity of leaf-based CO2 quantification.
Wagner et al., 2004
Can you say contradiction?
In short, whilst atmospheric CO2 concentrations have varied dramatically during the geological past due to natural processes, and have often been higher than today, the current rate of CO2 (and therefore temperature) change is unprecedented in almost the entire geological past.
They claim that “the current rate of CO2 (and therefore temperature) change is unprecedented in almost the entire geological past,” but then state the following:
Given the record of past climate change (Section 1), the magnitude of recent observed climate change is not unusual.
They assert that “the geological record is consistent with predictions that the long-term magnitude and rate of future sea-level rise will be highly sensitive to future CO2 emission scenarios.”
The geological record is consistent with predictions that the long-term magnitude and rate of future sea-level rise will be highly sensitive to future CO2 emission scenarios and may include intervals of very rapid rise.
However, there is no relationship between CO2 and sea level in the geological record.
Left to right: Generalized cross section along northern GOM region (Galloway et al., 2009), depositional phases are numbered. Relative sea level (Miller et al., 2005), atmospheric CO2 (Berner & Kothavala, 2001) and temperature anomalies (Royer et al., 2004). Click for image.
William Galloway, of the University of Texas Jackson School of Geosciences, summarized the depositional history of the Gulf Coast/Gulf or Mexico in this must read paper (I must read it, because he let me have a copy of it)…
Depositional history can be generalized in seven phases: (1) Middle-Late Jurassic evaporite and carbonate deposition in a broad, shallow, restricted to open marine basin. (2) Latest Jurassic-Early Cretaceous sand-rich clastic progradation from the northern margins. (3) Late-Early Cretaceous development of a rimmed carbonate shelf. (4) Late Cretaceous mixed clastic and carbonate aggradation of the continental margins. (5) Resurgent Paleogene clastic progradation and filling centered in the NW basin. (6) Miocene progradation and basin filling centered in the central and NE Gulf. (7) Late Neogene climatically and eustatically influenced progradation along the central Gulf margin. In contrast to the broad, progradational sediment wedge of the northern Gulf, the Florida margin is a primarily aggradational carbonate platform.
Figure _ clearly demonstrates the importance of climate, atmospheric CO2 and sea level cycles in the depositional history of the US Gulf Coast/Gulf of Mexico; but no correlation of CO2 and sea level. Note that most of the source rock formations were deposited when atmospheric CO2 was above 1,000 ppm and the Earth was considerably warmer than it is today. The temperature and CO2 plots have 10 million year resolutions; they are highly smoothed. However, there is almost no relationship between CO2 and temperature on a geological time scale.
References
Bereiter, Bernhard. Sarah Eggleston, Jochen Schmitt, Christoph Nehrbass-Ahles, Thomas F. Stocker, Hubertus Fischer, Sepp Kipfstuhl and Jerome Chappellaz. 2015. Revision of the EPICA Dome C CO2 record from 800 to 600 kyr before present. Geophysical Research Letters. . doi: 10.1002/2014GL061957. LINK
Bereiter et al. (2014), Revision of the EPICA Dome C CO2 record from 800 to 600 kyr before present, Geophysical Research Letters, doi: 10.1002/2014GL061957. Data
Berner, R.A. and Z. Kothavala, 2001. GEOCARB III: A Revised Model of Atmospheric CO2 over Phanerozoic Time, American Journal of Science, v.301, pp.182-204, February 2001.
Dott, Robert H. & Roger L. Batten. Evolution of the Earth. McGraw-Hill, Inc. Second Edition 1976. p. 441.
Galloway, William. (2008). “Chapter 15 Depositional Evolution of the Gulf of Mexico Sedimentary Basin”. Volume 5: Ed. Andrew D. Miall, The Sedimentary Basins of the United States and Canada., ISBN: 978-0-444-50425-8, Elsevier B.V., pp. 505-549.
Jevrejeva, S., J. C. Moore, A. Grinsted, and P. L. Woodworth (2008). “Recent global sea level acceleration started over 200 years ago?”. Geophys. Res. Lett., 35, L08715, doi:10.1029/2008GL033611.
Jevrejeva, S. , J.C. Moore, A. Grinsted, A.P. Matthews, G. Spada. 2014. “Trends and acceleration in global and regional sea levels since 1807”. Global and Planetary Change. %vol 113, 10.1016/j.gloplacha.2013.12.004 https://www.psmsl.org/products/reconstructions/jevrejevaetal2014.php
Miller, Kenneth & Kominz, Michelle & V Browning, James & Wright, James & Mountain, Gregory & E Katz, Miriam & J Sugarman, Peter & Cramer, Benjamin & Christie-Blick, Nicholas & Pekar, S. (2005). “The Phanerozoic Record of Global Sea-Level Change”. Science (New York, N.Y.). 310. 1293-8. 10.1126/science.1116412.
Moberg, A., D.M. Sonechkin, K. Holmgren, N.M. Datsenko and W. Karlén. 2005. “Highly variable Northern Hemisphere temperatures reconstructed from low- and high-resolution proxy data”. Nature, Vol. 433, No. 7026, pp. 613-617, 10 February 2005.
Nerem, R. S., B. D. Beckley, J. T. Fasullo, B. D. Hamlington, D. Masters, G. T. Mitchum. “Climate-change–driven accelerated sea-level rise”. Proceedings of the National Academy of Sciences. Feb 2018, 115 (9) 2022-2025; DOI: 10.1073/pnas.1717312115
Pagani, Mark, Michael Arthur & Katherine Freeman. (1999). “Miocene evolution of atmospheric carbon dioxide”. Paleoceanography. 14. 273-292. 10.1029/1999PA900006.
Royer, D. L., R. A. Berner, I. P. Montanez, N. J. Tabor and D. J. Beerling. “CO2 as a primary driver of Phanerozoic climate”. GSA Today, Vol. 14, No. 3. (2004), pp. 4-10
Tripati, A.K., C.D. Roberts, and R.A. Eagle. 2009. “Coupling of CO2 and Ice Sheet Stability Over Major Climate Transitions of the Last 20 Million Years”. Science, Vol. 326, pp. 1394 1397, 4 December 2009. DOI: 10.1126/science.1178296
Wagner F, et al., 1999. Century-scale shifts in Early Holocene CO2 concentration. Science 284:1971–1973.
Wagner F, Kouwenberg LLR, van Hoof TB, Visscher H, 2004. Reproducibility of Holocene atmospheric CO2 records based on stomatal frequency. Quat Sci Rev 23:1947–1954. LINK
Zachos, J. C., Pagani, M., Sloan, L. C., Thomas, E. & Billups, K. “Trends, rhythms, and aberrations in global climate 65 Ma to present”. Science 292, 686–-693 (2001).
Observations from the geological record show that atmospheric CO2 concentrations are now at their highest levels in at least the past 3 million years.
Maybe even 12 million years…
Figure 1. Neogene-Quaternary temperature and carbon dioxide (older is toward the left).
This passage from Evolution of the Earth (1976) is just as true today as when we were geology students way back in the Pleistocene…
Unfortunately we cannot estimate accurately changes of past CO2 content of either atmosphere or oceans, nor is there any firm quantitative basis for estimating the the magnitude of drop in carbon dioxide content necessary to trigger glaciation. Moreover the entire concept of an atmospheric greenhouse effect is controversial, for the rate of ocean-atmosphere equalization is uncertain.
Dott & Batten, 1976
While methods of estimating past atmospheric CO2 concentrations have improved since the 1970’s, we can’t even be certain that the atmospheric concentration of CO2 during the much warmer Mid-Miocene Climatic Optimum was significantly elevated relative to the extremely low values of the Quaternary Period.
Furthermore, the current speed of human-induced CO2 change and warming is nearly without precedent in the entire geological record, with the only known exception being the instantaneous, meteorite-induced event that caused the extinction of non-bird-like dinosaurs 66 million years ago.
While this is certainly possible, there are no geological records of CO2 change that have sufficient resolution to make this claim with any degree of certainty. The only exception would be the Law Dome ice cores in Antarctica, which only go back about 2,000 years.
This composite ice core CO2 record (0-800 kyr BP) from Bereiter et al. (2014) appears to present a very convincing Hockey Stick.
Figure 2. Composite CO2 record (0-800 kyr BP) from Bereiter et al. (2014).
This is a composite of the following ice cores:
-51-1800 yr BP:’
Law Dome (Rubino et al., 2013)
1.8-2 kyr BP:
Law Dome (MacFarling Meure et al., 2006)
2-11 kyr BP:
Dome C (Monnin et al., 2001 + 2004)
11-22 kyr BP:
WAIS (Marcott et al., 2014) minus 4 ppmv (see text)
22-40 kyr BP:
Siple Dome (Ahn et al., 2014)
40-60 kyr BP:
TALDICE (Bereiter et al., 2012)
60-115 kyr BP:
EDML (Bereiter et al., 2012)
105-155 kyr BP:
Dome C Sublimation (Schneider et al., 2013)
155-393 kyr BP:
Vostok (Petit et al., 1999)
393-611 kyr BP:
Dome C (Siegenthaler et al., 2005)
612-800 kyr BP:
Dome C (Bereiter et al., 2014)
These ice cores are of vastly different resolutions. Petit et al., 1999 indicate that the CO2 resolution for Vostok is 1,500 years. Lüthi et al., 2008 suggest a CO2 resolution of about 500 years for Dome C. It appears that the high resolution Law Dome DE08 core was just spliced on to the lower frequency older ice cores.
If I apply smoothing filters to the DE08 ice core in order to match the resolution of the lower resolution ice cores, I get a considerably different picture.
Figure 3. A 500-yr smoothing filter totally removes the Hockey Stick’s blade.
The lower frequency ice cores are not capable of resolving century scale CO2 shifts. As such, they cannot be used to rule out the possibility of short duration fluctuations comparable to the industrial era rise in atmospheric CO2 during the early Holocene and Pleistocene. And thus do not contradict the conclusions of Wagner et al., 1999:
In contrast to conventional ice core estimates of 270 to 280 parts per million by volume (ppmv), the stomatal frequency signal suggests that early Holocene carbon dioxide concentrations were well above 300 ppmv.
[…]
Most of the Holocene ice core records from Antarctica do not have adequate temporal resolution.
[…]
Our results falsify the concept of relatively stabilized Holocene CO2 concentrations of 270 to 280 ppmv until the industrial revolution. SI-based CO2 reconstructions may even suggest that, during the early Holocene, atmospheric CO2 concentrations that were 300 ppmv could have been the rule rather than the exception.
Wagner et al., 1999
Or Wagner et al., 2004:
The majority of the stomatal frequency-based estimates of CO2 for the Holocene do not support the widely accepted concept of comparably stable CO2 concentrations throughout the past 11,500 years. To address the critique that these stomatal frequency variations result from local environmental change or methodological insufficiencies, multiple stomatal frequency records were compared for three climatic key periods during the Holocene, namely the Preboreal oscillation, the 8.2 kyr cooling event and the Little Ice Age. The highly comparable fluctuations in the paleo-atmospheric CO2 records, which were obtained from different continents and plant species (deciduous angiosperms as well as conifers) using varying calibration approaches, provide strong evidence for the integrity of leaf-based CO2 quantification.
Wagner et al., 2004
Can you say contradiction?
In short, whilst atmospheric CO2 concentrations have varied dramatically during the geological past due to natural processes, and have often been higher than today, the current rate of CO2 (and therefore temperature) change is unprecedented in almost the entire geological past.
They claim that “the current rate of CO2 (and therefore temperature) change is unprecedented in almost the entire geological past,” but then state the following:
Given the record of past climate change (Section 1), the magnitude of recent observed climate change is not unusual.
They assert
The geological record is consistent with predictions that the long-term magnitude and rate of future sea-level rise will be highly sensitive to future CO2 emission scenarios and may include intervals of very rapid rise.
Left to right: Generalized cross section along northern GOM region (Galloway et al., 2009), depositional phases are numbered. Relative sea level (Miller et al., 2005), atmospheric CO2 (Berner & Kothavala, 2001) and temperature anomalies (Royer et al., 2004). Click for image.
References
Bereiter, Bernhard. Sarah Eggleston, Jochen Schmitt, Christoph Nehrbass-Ahles, Thomas F. Stocker, Hubertus Fischer, Sepp Kipfstuhl and Jerome Chappellaz. 2015. Revision of the EPICA Dome C CO2 record from 800 to 600 kyr before present. Geophysical Research Letters. . doi: 10.1002/2014GL061957. LINK
Bereiter et al. (2014), Revision of the EPICA Dome C CO2 record from 800 to 600 kyr before present, Geophysical Research Letters, doi: 10.1002/2014GL061957. Data
Dott, Robert H. & Roger L. Batten. Evolution of the Earth. McGraw-Hill, Inc. Second Edition 1976. p. 441.
Pagani, Mark, Michael Arthur & Katherine Freeman. (1999). “Miocene evolution of atmospheric carbon dioxide”. Paleoceanography. 14. 273-292. 10.1029/1999PA900006.
Royer, D. L., R. A. Berner, I. P. Montanez, N. J. Tabor and D. J. Beerling. “CO2 as a primary driver of Phanerozoic climate”. GSA Today, Vol. 14, No. 3. (2004), pp. 4-10
Tripati, A.K., C.D. Roberts, and R.A. Eagle. 2009. “Coupling of CO2 and Ice Sheet Stability Over Major Climate Transitions of the Last 20 Million Years”. Science, Vol. 326, pp. 1394 1397, 4 December 2009. DOI: 10.1126/science.1178296
Wagner F, et al., 1999. Century-scale shifts in Early Holocene CO2 concentration. Science 284:1971–1973.
Wagner F, Kouwenberg LLR, van Hoof TB, Visscher H, 2004. Reproducibility of Holocene atmospheric CO2 records based on stomatal frequency. Quat Sci Rev 23:1947–1954. LINK
Zachos, J. C., Pagani, M., Sloan, L. C., Thomas, E. & Billups, K. “Trends, rhythms, and aberrations in global climate 65 Ma to present”. Science 292, 686–-693 (2001).
The largest sea-level decline took place during the last glacial period about 20,000 years ago, when the water level dropped by about 400 feet. That was followed by a foot per decade rise in sea level – a rapid pace that slowed from 10,000 to 2,000 years ago. Sea-level rise was then at a standstill until around 1900, when rates began rising as human activities began influencing the climate.
“The largest sea-level decline took place during the last glacial period about 20,000 years ago, when the water level dropped by about 400 feet.”
The sea-level decline of the last Pleistocene glacial stage didn’t take place about 20 kya. It started about 130 kya and ended about 20 kya… And it was unremarkable in the context of the Late Pleistocene.
Late Pleistocene sea level, older is toward the right.. (Spratt & Lisiecki, 2016)
“That was followed by a foot per decade rise in sea level – a rapid pace that slowed from 10,000 to 2,000 years ago.”
It abruptly slowed about 9 kya, reaching its Holocene maximum between 7 and 3 kya.
Siddall et al., 2003 is a reconstruction of global sea level over the past 470,000 years constructed from Red Sea sediment cores. Here is the reconstruction since the last glacial maximum.
Older is toward the right. Note the error bar is ±12 meters.
“Sea-level rise was then at a standstill until around 1900, when rates began rising as human activities began influencing the climate.”
Compared to the 20th and 21st centuries, sea level was oscillating wildly from 2 kya to 1900 AD.
Brock et al., 2008 featured the Holocene portion of Siddall’s reconstruction, clearly demonstrating that sea level was significantly higher than today for most of the past 3,000 years.
Global last 7,000 years, error bars omitted. Older toward left.
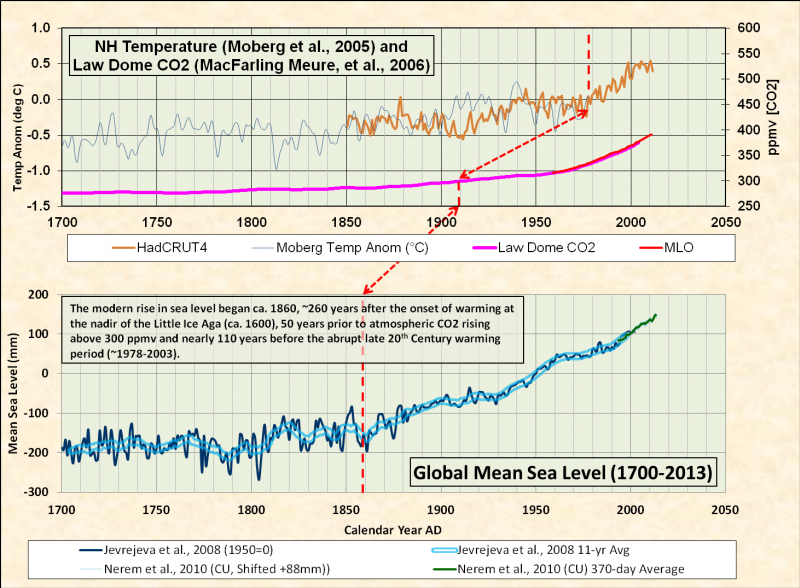
Sea level was falling from about 1 kya to 1850 AD due to neoglaciation. It’s been rising at a wholly unremarkable rate of about 1-3 mm/yr since the mid-19th century.
Sea level reconstruction from tide gauge data (Jevrejeva et al., 2014). Note rock pick added for scale. Older is toward the left.
Sea level reconstructions are terribly imprecise. Oxygen isotope chronologies can have error bars as large as 30 meters (Siddall et al., 2003). Dating error bars are also generally fairly large. Fossil terraced beaches provide some of the best evidence for past higher sea levels, but they aren’t particularly easy to put into an Excel spreadsheet. Uplift and subsidence of the land can have a large impact on local sea level changes. Woodroffe & Horton, 2005 (linked) provide an excellent summary of the methods and challenges in reconstructing paleo-sea level changes.
Evidence for the Mid- to Late-Holocene highstand(s) is not present everywhere. Evidence is lacking on the Mississippi delta (Törnqvist et al, 2004), probably due to rapid subsidence. While it may not have been universal or synchronous, there does appear to be strong evidence that Holocene sea levels were significantly higher than today over much of the world and that past natural oscillations were of much higher magnitude than observed sea level changes over the past ~200 years.
This is would be fraud in the private sector…
Earth hasn’t been an ice-free world in nearly 40 million years. It’s as irrelevant to the science as an image of what a water-free world would look like.
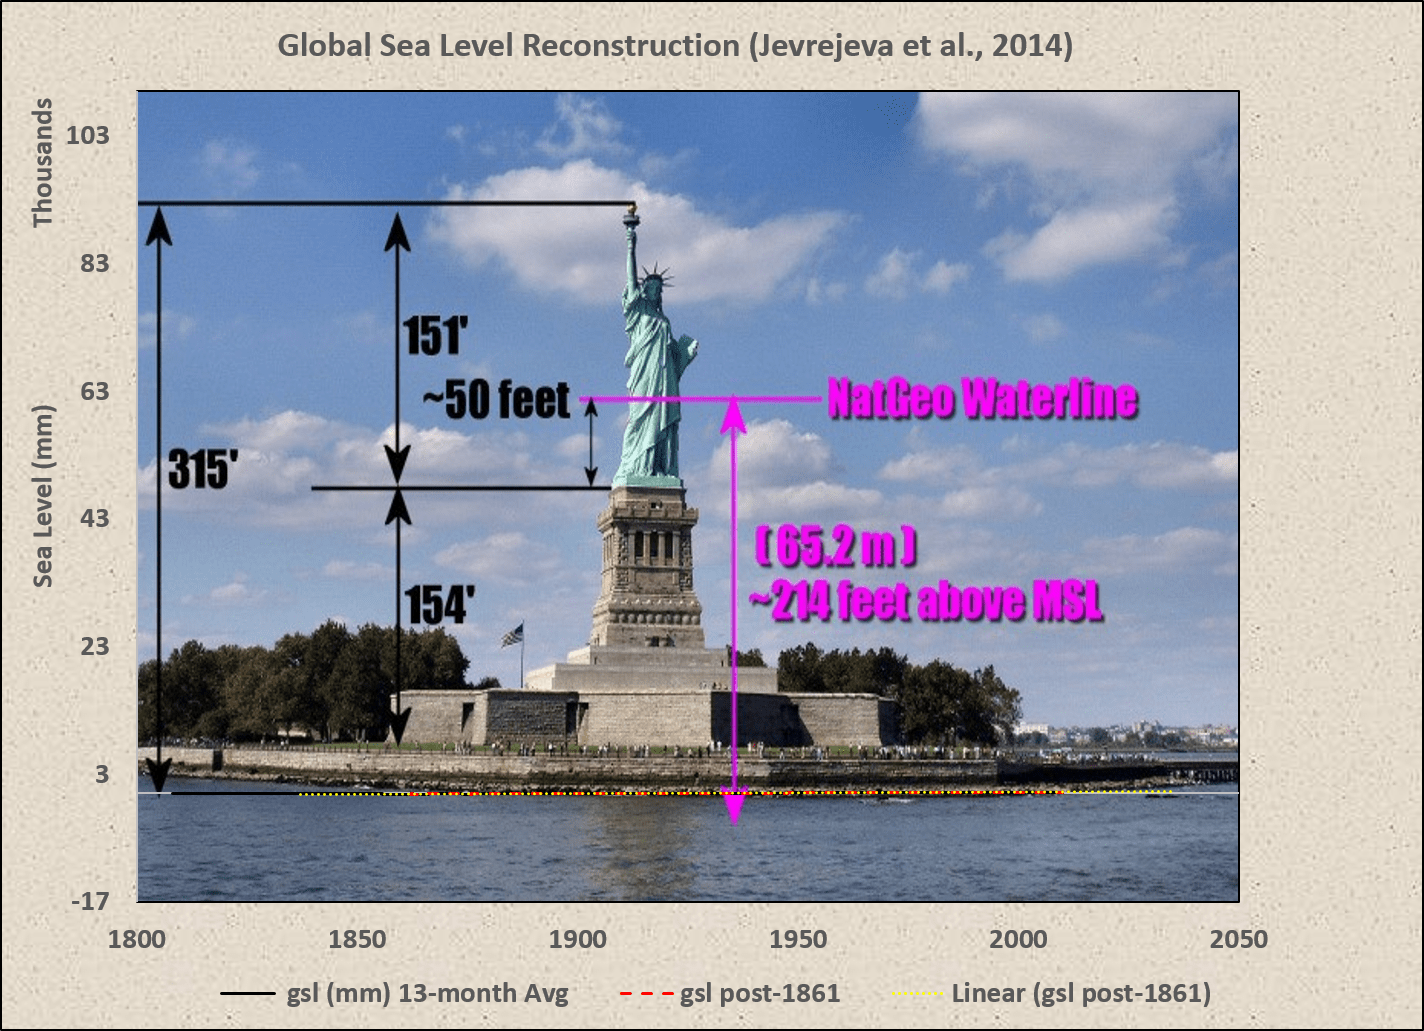
This is how actual sea level rise relates to the Statue of Liberty.
Lady Liberty has nothing to fear from the Adjustocene Sea. What’s that? You can’t see the sea level trend? It’s right down there at sea level… between the water and the base of Liberty Island.
The study showed that periods of nearly ice-free conditions, such as 17 million to 13 million years ago, occurred when the concentration of atmospheric carbon dioxide – a key greenhouse gas driving climate change – was not much higher than today.
17 to 13 Mya was not “nearly ice-free”.
Zachos et al., 2001 (older is toward the bottom).
And atmospheric CO2 could have been anywhere from 200 to 500 ppm during the Mid-Miocene Climatic Optimum (MMCO).
Neogene-Quaternary temperature and carbon dioxide (older is toward the left).
We can see that the range of estimates for MMCO range from 200 to 500 ppm, rendering any efforts to draw conclusions about CO2 and the MMCO totally pointless. According to Pagani et al, 1999:
There is no evidence for either high pCO2 during the late early Miocene climatic optimum or a sharp pCO2 decreases associated with
EAIS growth.
Pagani et al., 1999
Pagani et al., suggest that changes in oceanic circulation driven by plate tectonics (opening of the Drake Passage) and the presence (or lack thereof) of a large polar ice sheet were the primary drivers of Miocene climate change.
However, glacial periods occurred when the Earth was previously thought to be ice-free, such as from 48 million to 34 million years ago.
“Glacial periods” have occurred throughout the Cenozoic. This is why the sedimentary record demonstrates cyclical sea level changes. While the frequency of these cycles was lower during the Paleogene, they still occurred.
Global cycles of sea level change over Cenozoic Era, Vail et al., 1977.
Any “glacial periods” from 48 to 34 Mya occurred when the Earth was cooling (but much warmer than today) and atmospheric CO2 was anywhere from 400 to 2500 ppm.
This may come as a surprise to some people, but prior to January 20, 2009, fighting climate change had never been one of the core missions of the US Navy. Thankfully, it no longer is…
Navy quietly ends climate change task force, reversing Obama initiative
J.D. Simkins
August 26, 2019
When he took office as secretary of defense, retired Marine Gen. Jim Mattis urged the armed forces to battle the effects of global climate change.
[…]
But the Navy quietly shut down its specialized U.S. Navy Task Force Climate Change in March, reversing an Obama-era initiative designed to prepare naval leadership for global shifts in sea levels, melting ice sheets and ocean temperatures.
But questions soon arose into whether the task force’s demise could be traced to ongoing efforts by President Donald J. Trump to end numerous federal climate change initiatives, reversing policies instituted by the previous administration beginning in 2009.
“I believe that there’s a change in weather, and I think it changes both ways,” Trump said in a June 2019 interview on “Good Morning Britain.”
“Don’t forget it used to be called global warming. That wasn’t working. Then it was called climate change. Now it’s actually called extreme weather, because with extreme weather, you can’t miss.”
While the Navy does continue to pay attention to the weather, as it pertains to naval operations, climate change is not a core mission of the US Navy.
The mission of the Navy is to maintain, train and equip combat-ready Naval forces capable of winning wars, deterring aggression and maintaining freedom of the seas.
From the Barbary to the Somali pirates, “maintaining freedom of the seas” has been one of the Navy’s primary missions. Since World War II, the backbone of the US Navy has been the fleet or attack aircraft carrier. Aircraft carriers are like mobile diplomatic outposts, with a “runway” capable of handling a wide range of combat aircraft (a very “big stick.”)
“When word of a crisis breaks out in Washington, it’s no accident that
the first question that comes to everyone’s lips is:
‘Where’s the nearest carrier?‘”
The US Navy is the only navy in the world operating large “super-carriers.” With 90,000-100,000 ton displacements, the Nimitz and Gerald R. Ford class aircraft carriers are 40-50% larger than they next largest, the UK Queen Elizabeth Class, just coming into service.
Aircraft carriers operate in strike groups. A US Navy strike group generally consists of 1 carrier, 1-2 Ticonderoga class guided missile cruisers, 4-6 Arleigh Burke class guided missile destroyers and are often accompanied by 1-2 Virginia, Sea Wolf or Los Angeles class attack submarines, along with other support vessels. Being a floating airbase, unescorted carriers would be vulnerable to air, surface and submarine attack.
It also appears that aircraft carriers are particularity vulnerable to the vector-borne COVID-19 disease.
French carrier surpasses Theodore Roosevelt with over 1,000 confirmed cases of COVID-19
J.D. Simkins
April 20
Recent reports out of France say that more than 1,000 sailors aboard the country’s aircraft carrier, Charles de Gaulle, have tested positive for COVID-19, a number that could continue to surge as the crew awaits approximately 930 more test results.
The outbreak onboard the French navy’s flagship forced leadership to call off the remaining two weeks of the carrier’s scheduled deployment to the North Atlantic. The ship, which carries a crew of nearly 1,800, pulled into port last week at Toulon Naval Base in southern France.
In all, 1,081 crew members from the Charles de Gaulle naval group have tested positive for the novel coronavirus. That total comes almost entirely from the carrier, and includes at least two U.S. sailors who were assigned to the ship as part of the U.S. Navy’s Personnel Exchange Program.
[…]
Partially complicating the early detection process onboard Charles de Gaulle was the rate of asymptomatic carriers. Of the confirmed cases, nearly half showed no symptoms, according to a New York Times report.
[…]
The debilitating spread of the virus onboard Charles de Gaulle, France’s lone carrier, has sparked concern about the nation’s ability to remain ready to fight.
Unlike the U.S. Navy, which touts 10 other active carriers in addition to the coronavirus-stricken Theodore Roosevelt, losing the Charles de Gaulle for an extended period could cripple France’s nuclear deterrence capabilities, the Times report said.
Nearly half of all confirmed infections were asymptomatic.
France’s only carrier was rendered combat-ineffective by ChiCom-19.
The US Navy has eleven aircraft carriers.
Aircraft carriers are the US Navy’s primary tool for force projection. A Nimitz Class nuclear powered aircraft carrier (CVN) carries an air group with substantial hitting power.
60 Hornets and Super Hornets can pack quite a punch as both fighter and attack jets.
Are eleven aircraft carriers a lot of flattops?
Over most of the past 20-25 years, the US Navy operated with at least twelve aircraft carriers. At any one time, four carriers would be deployed or available for deployment, and four would be in the early to mid stages of maintenance cycles and four would be completing maintenance cycles and/or preparing to deploy, two of which could be “surged” on relatively short notice. In September 2018, US Navy carrier deployments reached a 25 year low.
U.S. Aircraft Carrier Deployments at 25 Year Low as Navy Struggles to Reset Force
By: Sam LaGrone
September 26, 2018
THE PENTAGON – Aircraft carriers – the most visible tools of U.S. military power – are spending more time in maintenance and at home even as the Pentagon has declared it’s entered a new era of competition with China and Russia.
According to a USNI News analysis of more than 50 years of carrier air wing deployments over the last 15 months, the Navy has seen the lowest number of carrier strike groups underway since 1992, the year following the dissolution of the Soviet Union.
The Navy has deployed about 22 to 25 percent of its carriers since 2013. That total — which excludes training missions and exercises — is down from a 28-percent average for the rest of the era of the global war on terror. In 2018, to date, that number has been down to an average of about 15 percent of the Navy’s carriers committed to operational deployments.
For 22 days this summer, the Navy did not have a full carrier strike group deployed anywhere in the world available for national tasking, the service confirmed to USNI News. That’s the longest gap in the years USNI News studied.
Of the eleven currently commissioned US aircraft carriers, only five are currently deployed. However, the forward-deployed USS Ronald Reagan is undergoing maintenance at Yokosuka, Japan and USS Theodore Roosevelt (The Big Stick) is docked in Guam due to the COVID-19 outbreak on board. This leaves the Western Pacific without an effective carrier strike group (CSG). Amphibious assault ships (LHA & LHD) generally carry six USMC AV-8B Harrier jump jets. The Marine attack squadrons are in the process of transitioning to the more advanced F-35B Lighting II. The amphibious assault ships (“Gators”) can be deployed as “sea control ships” with less helicopters and up to twenty Harriers or Lightnings.
With major freedom of the seas commitments from the Middle East to the Western Pacific, the US Navy was already spread thin when COVID-19 disabled The Big Stick…
Part of The Big Stick’s mission was to “maintain freedom of the seas” in and around the South China Sea.
Carrier USS Theodore Roosevelt Leaves San Diego for Indo-Pacific Deployment
By: Gidget Fuentes
January 17, 2020
Family and friends said goodbye on Friday to more than 6,000 sailors with the Theodore Roosevelt Carrier Strike Group, which is leaving for a scheduled deployment to the U.S. Indo-Pacific Command region.
The Nimitz-class aircraft carrier USS Theodore Roosevelt (CVN-71) is departing its home berth at Naval Air Station North Island along with six ships with Carrier Strike Group 9 and aircraft with Carrier Air Wing 11, according to Naval Air Forces.
Joining the Theodore Roosevelt for the deployment is the Ticonderoga-class guided-missile cruiser USS Bunker Hill (CG-52). Guided-missile destroyers USS Russell (DDG-59), USS Paul Hamilton (DDG-60), USS Pinckney (DDG-91), USS Kidd (DDG-100), USS Rafael Peralta (DDG-115) are also part of the CSG along with the commander and staff of Destroyer Squadron 23 embarked on the carrier. The deployment will mark the first overseas assignment for the San Diego-based Peralta, which the Navy commissioned in July 2017.
[…]
The carrier strike group “will provide maritime security, maintain freedom of the seas in accordance with international law and customs, and operate with international partners and allies to promote regional stability and prosperity,” Naval Air Forces officials said in a statement announcing the deployment.
“7 SAN DIEGO (Jan. 17, 2020) The Nimitz-class aircraft carrier USS Theodore Roosevelt (CVN 71), flagship of the Theodore Roosevelt Carrier Strike Group, departs San Diego for a deployment. The Theodore Roosevelt Carrier Strike Group is on a regular scheduled Indo-Pacific deployment to promote ongoing peace, security, and stability throughout the entire Pacific theater of operations.(U.S. Navy photo by Mass Communication Specialist 2nd Class Kyle Carlstrom)” US Navy
On March 5, 2020, The Big Stick made a port call at Da Nang, Vietnam.
Theodore Roosevelt Strike Group Arrives in Vietnam
| Theodore Roosevelt Public Affairs | March 5, 2020
DA NANG, Vietnam — USS Theodore Roosevelt (CVN 71) and USS Bunker Hill (CG 52) arrived in Da Nang, March 5, for a scheduled port visit commemorating 25 years of U.S.-Vietnam diplomatic relations.
[…]
Sailors will participate in cultural and professional exchanges, community service projects, sports competitions, and receptions during the port visit.
“This visit will not only serve to strengthen our bilateral defense relationship, but also help further advance our cultural and professional ties,” said Capt. Brett Crozier, Theodore Roosevelt’s commanding officer. “We are honored to take part in this important port visit and to receive such a warm welcome.”
Theodore Roosevelt is America’s fourth Nimitz-class aircraft carrier with a crew of 5,000 Sailors who support and conduct air operations at sea. The strike group is comprised of a total of 6,500 Sailors, an aircraft carrier, an air wing, a cruiser, and six destroyers.
U.S. 7th Fleet conducts forward-deployed naval operations in support of U.S. national interests in the Indo-Pacific area of operations. As the U.S. Navy’s largest numbered fleet, 7th Fleet interacts with 35 other maritime nations to build partnerships that foster maritime security, promote stability, and prevent conflict.
The first three cases of the COVID-19 were reported in 24 March 2020. It was initially thought that the infection was related to the Da Nang port call, but the outbreak on USS Kidd (DDG-100) casts doubt on this.
USS Kidd Arrives in San Diego to Treat COVID-19 Outbreak; First Cases Emerged More than A Month After Hawaii Port Visit
By: Sam LaGrone
April 28, 2020
The second deployed U.S. warship to suffer a COVID-19 outbreak pulled into San Diego on Tuesday to begin the process of offloading, testing, isolating and treating the crew and disinfecting the ship to prepare to head back to sea.
As of Tuesday, 64 sailors on guided-missile destroyer USS Kidd (DDG-100) have tested positive for the virus, with 63 percent of the crew tested.
Two Kidd sailors have been medically evacuated to the United States, while 15 were transferred to amphibious warship USS Makin Island (LHD-8) for monitoring, the Navy announced on Tuesday.
[…]
In addition to the isolation and cleaning measures, the Navy Bureau of Medicine and the CDC will undertake a voluntary serology (pronounced: SIR-all-ah-gee) study of the crew to learn more about the spread of the virus, a Navy official confirmed to USNI News. That will involve collecting blood samples and swabs from the crew to learn how the virus spread throughout the ship. A similar study is underway aboard USS Theodore Roosevelt (CVN-71), which was the first deployed ship to suffer a COVID-19 outbreak.
[…]
The aircraft carrier has been in Guam since March 27 as the service works to mitigate the outbreak that infected 940 sailors and resulted in one death. Officials have told USNI News repeatedly that the service may never learn how the virus came aboard Theodore Roosevelt.
The same may be true for Kidd. The first sailor began to show symptoms of the virus on April 22, more than 30 days after the ship’s last port visit in Hawaii, according to a status update provided to Congress and reviewed by USNI News. The time between port visits and the first reported case of symptoms have raised questions inside the Navy as to how the virus operates and how long it could exist undetected on a ship.
Two sources familiar with the procedures on the ship told USNI News that Kidd had adhered to all of the CDC and Navy recommendations to keep the virus from spreading. Aside from underway replenishments, the ship’s crew did not have any interactions off the ship after leaving Hawaii, USNI News understands.
Kidd, initially deployed with the TR Carrier Strike Group, was detailed to a quickly-planned counter-narcotics operation in the Eastern Pacific when the first sailor began exhibiting symptoms of an “influenza-like illness” or ILI on April 22. The next day an eight-person medical team brought an Abbott machine with a COVID-19 testing ability aboard to start screening the crew.
From there, the outbreak spread rapidly among the crew, forcing the ship to head to port to purge the virus from the sailors and the ship.
“USS Kidd (DDG-100) arrives in San Diego on April 28, 2020. US Navy Photo”
The new “prime suspect” is the carrier’s air group.
COVID-19 outbreak on Theodore Roosevelt sparked by flight crews, officials believe
J.D. Simkins
April 15
By the time the aircraft carrier Theodore Roosevelt was ordered to port in Guam on March 26, the hulking ship was already being ambushed by the outbreak of an invisible enemy.
At sea on March 24, the first three cases were reported. Within 24 hours, the number of infected more than doubled. Each subsequent day yielded more confirmed cases, numbering 615 as of Wednesday. A 41-year-old chief petty officer became the first to succumb to COVID-19 on Monday, four days after being found unresponsive by other quarantined sailors.
Officials retracing the ship’s activity pointed to a scheduled port stop in Da Nang, Vietnam, as the source of the outbreak.
[…]
As Navy officials analyzed the ship’s chronological movement, however, the once-firm belief of where the virus first meandered onto the ship was called into question — and potentially debunked.
According to a Wall Street Journal report Wednesday, Navy officials now believe the outbreak on the carrier Roosevelt was initiated by the ship’s routine flight operations.
Numerous carrier on-board delivery flights originating in Japan, the Philippines, and Vietnam occurred in the days following the ship’s departure from Da Nang, the report said. With some of the first Roosevelt sailors to contract the virus coming from the carrier’s air wing, the picture began to clarify.
Furthermore, the eight sailors who first tested positive did so over the course of March 24 and 25, more than two weeks after the ship departed Da Nang — a time period in excess of the virus’ incubation. A Navy Times request for officials to confirm which units the first infected sailors belonged to was not returned as of publication.
Additional evidence materialized when the Navy pinpointed a hotel in Da Nang, where 30 sailors had stayed while Roosevelt was in port. Two British nationals who stayed at the same hotel later tested positive for COVID-19, the WSJ reported.
What does any of this have to do with COVID-19 being a potential anti-ship weapon?
Navy conducts year’s first FONOP in South China Sea
Geoff Ziezulewicz and Shawn Snow
January 28
When the U.S. Navy’s littoral combat ship Montgomery on Saturday skirted a disputed island in the South China Sea, Beijing scrambled two armed fighter-bomber jets and “expelled it” from the area, the state-run media reported.
Montgomery’s “freedom of navigation operation” was the first Navy FONOP this year in the South China Sea. The sea service conducts FONOPs to reemphasize that it’s an international byway, open to all shipping.
Beijing’s response also served as a reminder that China exerts large territorial claims across the Western Pacific and backs them up with a string of fortified atolls.
“On Jan. 25, a U.S. warship asserted navigational rights and freedoms in the Spratly Islands, consistent with international law,” Lt. Joe Keiley, a U.S. 7th Fleet spokesman, said in a statement.
The Montgomery’s FONOP “challenged the restrictions on innocent passage” in those waters imposed not only by China, but also Vietnam and Taiwan, Keiley said.
“The littoral combat ship Montgomery conducted a freedom of navigation operation, or FONOP, near contested South China Sea islands on Sunday, officials said. (Navy)”
Where was the Roosevelt Carrier Strike Group when Montgomery conducted its FONOP? In the Western Pacific, operating in the 7th Fleet area of responsibility.
“The Theodore Roosevelt Carrier Strike Group deployed on Jan. 17 from San Diego, Calif. The CSG is in the Western Pacific and is now operating in U.S. 7th Fleet. USS Theodore Roosevelt (CVN-71) most recently deployed from Oct. 2017 to May 2018.”
The US Navy has been very aggressively conducting FONOP’s in these waters because the PRC illegally claims them as territorial waters.
“The territorial claims in the South China Sea are complex and overlapping. Beijing’s claim, shown here as a thick red dotted line, is often represented on Chinese maps with nine long dashes — hence the term ‘nine-dash line.’” NPR
PRC’s claim was ruled invalid under the United Nations Convention on the Law of the Sea by the Permanent Court of Arbitration in The Hague.
Needless to say, the Peoples Republic of China considers these FONOP’s to be acts of provocation. Denying US naval air cover for such operations seems like a worthy military objective, particularly if it could be done in a relatively non-violent and untraceable manner. While, there is no evidence that the PRC intentionally disabled USS Theodore Roosevelt, they certainly would have noticed that COVID-19 easily rendered two western aircraft carriers combat-ineffective.
What’s so important about the South China Sea?
SOUTH CHINA SEA
February 7, 2013
Update: October 15, 2019
Since the publication of the South China Sea Analysis Brief in February 2013, world energy markets have continued to evolve.
To reflect these changes, EIA has updated its estimates of oil and liquefied natural gas flows through the South China Sea to include estimates for 2016. A complete update of the South China Analysis Brief will be available.
Overview
The South China Sea is a critical world trade route and a potential source of hydrocarbons, particularly natural gas, with competing claims of ownership over the sea and its resources.
Stretching from Singapore and the Strait of Malacca in the southwest to the Strait of Taiwan in the northeast, the South China Sea is one of the most important trade routes in the world. The sea is rich in resources and holds significant strategic and political importance.
[…]
Several of the countries bordering the sea declare ownership of the islands to claim the surrounding sea and its resources. The Gulf of Thailand borders the South China Sea, and although technically not part of it, disputes surround ownership of that Gulf and its resources as well.
[…]
With Southeast Asian domestic oil production projected to stay flat or decline as consumption rises, the region’s countries will look to new sources of energy to meet domestic demand. China in particular promotes the use of natural gas as a preferred energy source and set an ambitious target of increasing the share of natural gas in its energy mix from 3 percent to 10 percent by 2020. The South China Sea offers the potential for significant natural gas discoveries, creating an incentive to secure larger parts of the area for domestic production.
[…]
Global trade
More than half of the world’s annual merchant fleet tonnage passes through the Straits of Malacca, Sunda, and Lombok, with the majority continuing on to the South China Sea. Almost a third of global crude oil and over half of global LNG trade passes through the South China Sea, making it one of the most important trade routes in the world.
Wind works fairly well in Texas for exactly one reason: Physical geography.
The wind resource in the Lower Plains has some seasonal variability, but is a fairly consistent resource.
Would Texas be better off with no wind and more coal and natural gas? At natural gas prices of $2-2.50/mcf… We probably would be better off… But that doesn’t mean that wind doesn’t work here. Texas has relatively low electricity rates despite our investment in wind. When the decisions were made to support the exploitation of Texas’ winde resource, natural gas was $5-12/mcf and no one anticipated that the “shale revolution” was right around the corner.
Chesapeake CEO Aubrey McClendon on August 1, 2008…
We think gas prices will stay in this $9 to $11 range, there’ll be times like in July when they’re above it, there’ll be times when they’re below it and of course the weather will matter a lot as well. But we’re pretty confident that much below $9 you’d see a drop off in drilling activity particularly among the conventional drilling and then those pretty aggressive 35% to 40% first year declines are going to kick in and rebalance the market.
I saw something the other day where some analysts had come up with production in 2010 was going to be up by something like 8 to 10 BCF a day and gas prices were going to be $6.25. That kind of analysis I think can only come at the dangerous intersection of Excel and PowerPoint, it can’t happen in reality.
No business or industry could out-spend the Climatariat.
Unlike governments, academia and nonprofit organizations, businesses are legally bound to protect the fiduciary interests of their owners/shareholders. Spending large sums of shareholders’ money for purposes not directly related to increasing shareholder value is not consistent with this fiduciary responsibility. The purpose of a business is to generate a profitable return for its owners/shareholders.
Governments, academia and nonprofit organizations are free to spend every bit of their income on AGW propaganda. Furthermore, governments have the power to confiscate business earnings and spend it on AGW propaganda.
Brulle (2013) found that 91 climate change counter-movement (CCCM) organizations had a combined annual income of about $900 million/yr, with $64 million/yr coming from “foundation support” (AKA industries).
Climatic Change
February 2014, Volume 122, Issue 4, pp 681-694
Date: 21 Dec 2013
–
Institutionalizing delay: foundation funding and the creation of U.S. climate change counter-movement organizations
–
Robert J. Brulle
–
This paper conducts an analysis of the financial resource mobilization of the organizations that make up the climate change counter-movement (CCCM) in the United States. Utilizing IRS data, total annual income is compiled for a sample of CCCM organizations (including advocacy organizations, think tanks, and trade associations). These data are coupled with IRS data on philanthropic foundation funding of these CCCM organizations contained in the Foundation Center’s data base. This results in a data sample that contains financial information for the time period 2003 to 2010 on the annual income of 91 CCCM organizations funded by 140 different foundations. An examination of these data shows that these 91 CCCM organizations have an annual income of just over $900 million, with an annual average of $64 million in identifiable foundation support. The overwhelming majority of the philanthropic support comes from conservative foundations. Additionally, there is evidence of a trend toward concealing the sources of CCCM funding through the use of donor directed philanthropies. LINK
The total average annual income of 91 “CCCM” organizations was ~$900 million from 2003-2010. An average of $64 million per year of that total came from philanthropic foundations. About 5% of the $64M/yr came from Koch affiliated foundations and about 1% came from the ExxonMobil Foundation.
The CCCM’s include the Heritage Foundation, American Enterprise Institute, Cato and just about every pro-business libertarian/conservative think tank in the US. While all of these organizations devote at least a fraction of their resources to protecting the US economy from Gorebots, greenhadists and enviromarxists, the only ones primarily focused on the AGW fraud are Heartland Institute and the Competitive Enterprise Institute, which receive a whopping 2-3% of ~$64 million per year from as many as 140 different foundations.
As of March 2017…
The Natural Resources Defense Council is totally dedicated to the imposition of Enviromarxism in the USA and religiously devoted to the AGW myth. Their annual income ($100 million) is more than the combined income of the American Enterprise Institute ($45 million), Cato Institute ($29 million), Heartland Institute ($5) and Competitive Enterprise Institute ($6 million).
The Columbia Earth Institute (run by Marxist economist Jeffrey Sachs) has an annual budget of ~$130 million…
In the 21st century, the preeminent need of our economy and society is to solve the problem of global sustainability…
–
[…]
–
The problem with the modern university is that it is organized around disciplinary fields, like biology and economics, or professional skills, such as engineering and law. While public policy schools have brought together many fields to attempt to solve policy problems, and business schools have done the same in attempting to train business leaders, both lack the grounding in sciences and engineering needed to address the issues of global sustainability. What is needed is a new form of academic organization that is university-wide, with the mission of institutionalizing interaction among all of these fields to address the problems of global sustainability.
–
The Earth Institute is precisely that: a new form of academic institution that integrates the knowledge base of the 21st century university to address the problems of global sustainability. Its mission is to develop programs of research, education, outreach and practical application of knowledge to address the critical issue of global sustainability.
–
[…]
–
The Institute is not a school, and does not grant degrees, but has partnered with schools to create and in many cases manage educational programs. These educational programs include non-degree programs of adult and executive education, but they also include the following degree programs:
$130 million per year to teach liberal arts majors to sound “sciencey” when spouting Enviromarxist psychobabble.
As of 2014, our Federal government was spending least $12 billion (more like $21 billion) on the AGW myth. Here’s the just “tip of the climateberg”…
Federal funding for climate change research, technology, international assistance, and adaptation has increased from $2.4 billion in 1993 to $11.6 billion in 2014, with an additional $26.1 billion for climate change programs and activities provided by the American Recovery and Reinvestment Act in 2009. As shown in figure 1, the Office of Management and Budget (OMB) has reported federal climate change funding in three main categories since 1993:
–
technology to reduce emissions,
science to better understand climate change, and
international assistance for developing countries.
–
Figure 1: Reported Federal Climate Change Funding by Category, 1993-2014
While the billions spent by Enviromarxist terrorist groups (NRDC, WWF, Greenpeace, Sierra Club, etc.), academia and government pushing the AGW fraud are at least an order of magnitude larger than CCCM spending, the cost of mostly pointless regulations is at least 3 orders of magnitude (1,000 times) greater than CCCM spending.
Then there’s the matter of those escalating climate-premised EPA regulation costs that are killing businesses and jobs under cover of the Clean Air Act. These rampant overreaches are being justified by the agency’s Endangerment Finding proclaiming CO2 to be a pollutant. The finding ignored a contrary conclusion in EPA’s own “Internal Study on Climate” that: “Given the downward trend in temperatures since 1998 (which some think will continue until at least 2030), there is no particular reason to rush into decisions based upon a scientific hypothesis that does not appear to explain most of the available data.”
–
The Small Business Administration estimates that compliance with such regulations costs the U.S. economy more than $1.75 trillion per year — about 12%-14% of GDP, and half of the $3.456 trillion Washington is currently spending. The Competitive Enterprise Institute believes the annual cost is closer to $1.8 trillion when an estimated $55.4 billion regulatory administration and policing budget is included. CEI further observes that those regulation costs exceed 2008 corporate pretax profits of $1.436 trillion; tower over estimated individual income taxes of $936 billion by 87%; and reveal a federal government whose share of the entire economy reaches 35.5% when combined with federal 2010 spending outlays. LINK
The Climatariat demonstrate even more mental deficiency when they babble on about ExxonMobil, the Koch Brothers than they do when they babble about the 97% consensus supporting their 95% failed hypothesis.


 Late Pleistocene sea level, older is toward the right.. (Spratt & Lisiecki, 2016)

 Global last 7,000 years, error bars omitted. Older toward left.


 Steinthorsdottir et al., 2019


/arc-anglerfish-arc2-prod-mco.s3.amazonaws.com/public/HOCPDBC5CRFEFK7M3HXSZWPLI4.jpg?w=700&ssl=1)


