The concept of gas diffusion in ice cores can be a confusing topic.
The age of the layers of ice can be fairly easily and accurately determined. The age of the air trapped in the ice is not so easily or accurately determined. Currently the most common method for aging the air is through the use of “firn densification models” (FDM). Firn is more dense than snow; but less dense than ice. As the layers of snow and ice are buried, they are compressed into firn and then ice. The depth at which the pore space in the firn closes off and traps gas can vary greatly… So the delta between the age of the ice and the age of the air can vary from as little as 30 years to more than 2,000 years.
The DE08 core from Law Dome core has a delta of 30 years. When the core was drilled in 1992 pores didn’t close off until a depth of 83 m, in ice that formed in 1939. According to the firn densification model, air from 1969 was trapped at that depth in ice that was deposited in 1939. It doesn’t seem reasonable to assume that “1969” air was trapped at 83 m in “1939” ice It seems to me that at depth, there would be a mixture of air permeating downward, in situ air, and older air that had migrated upward before the ice fully “lithified.” The air trapped in the 1939 layer should be a blend of air from 1909 to 1969. At the time that the 1939 layer was deposited, the ice crystals above 1909 would not have “lithified” yet. In 1939, the air within the interstitial pore space would be a mixture of 1909 to 1939 air. By the time the 1969 layer was deposited and the 1939 layer “lithified,” the air at the 1939 layer would have been a blend of 1909 to 1969 air.
Here are a schematic diagrams of the two models…
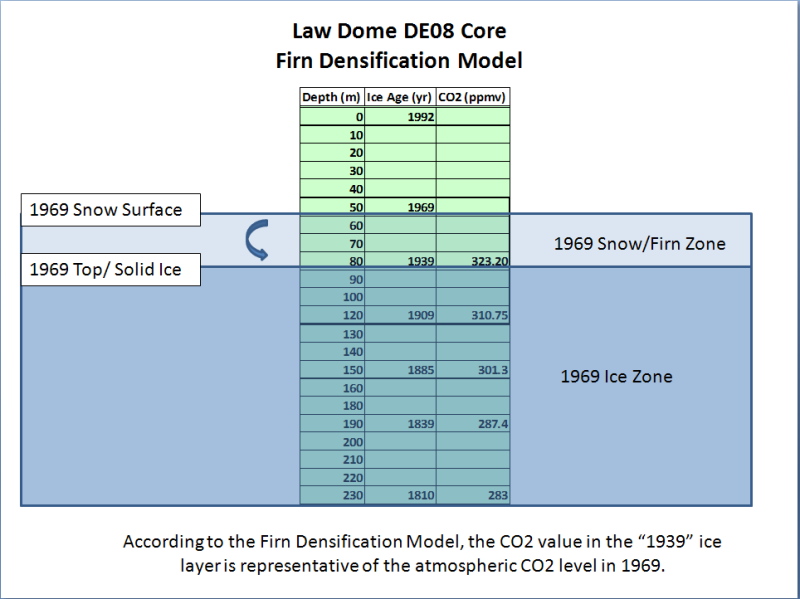
Fig. 1) Schematic diagram of DE08 firn densification model.
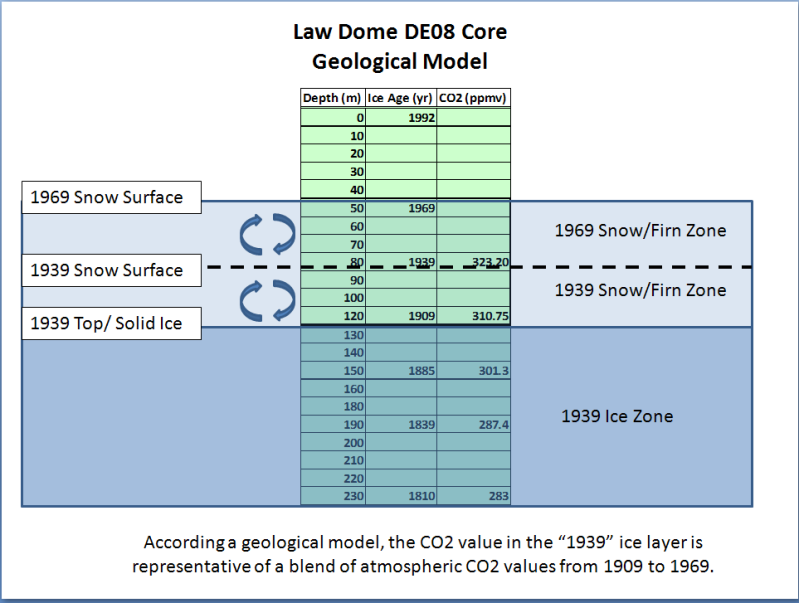
Fig. 2) Schematic diagram of DE08 geological model.
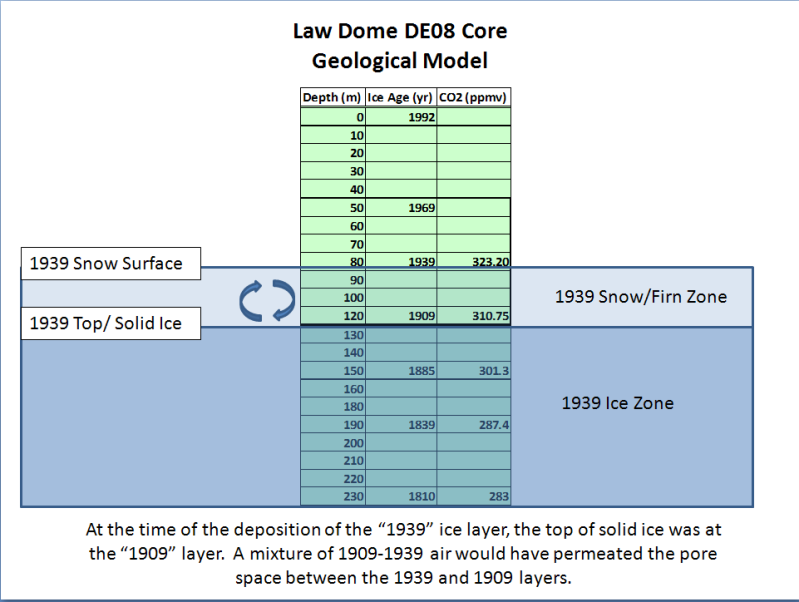
At the time of deposition of the 1939 ice layer, the interval from 1939 down to 1909 would have been composed of unconsolidated ice, snow and firn. A mixture of 1909-1939 air would have permeated the pore space.
The 1939 layer did not “lithify” until after the depostion of the 1969 layer. The interval from 1969 down to 1939 would have been composed of unconsolidated ice, snow and firn. A mixture of 1939-1969 air would have permeated the pore space.

If the geological model is correct, the CO2 values in the DE08 core are ~60-yr moving averages of atmospheric CO2 levels centered on the ice layer. They are not representative of atmospheric CO2 30 years after the ice layer was deposited as is assumed in the firn densification model.
Plant stomata (Kouwenberg et al.,2005) and contemporary chemical analyses (Beck, 2007) both indicate that CO2 levels in the 1930’s to 1940’s were in the 340 to 400 ppmv range. If CO2 levels had risen in response to the early 20th century warming and then declined in response to the very sharp cooling from the mid 1940’s to mid 1950’s, we should be able to see indications of this in the DE08 core. Using the firn densification model, we do not see evidence of high CO2 levels in the 1930’s to 1940’s. If we use the geological model, we see that the DE08 core is fully consistent with the high CO2 levels in the 1930’s and 1940’s….
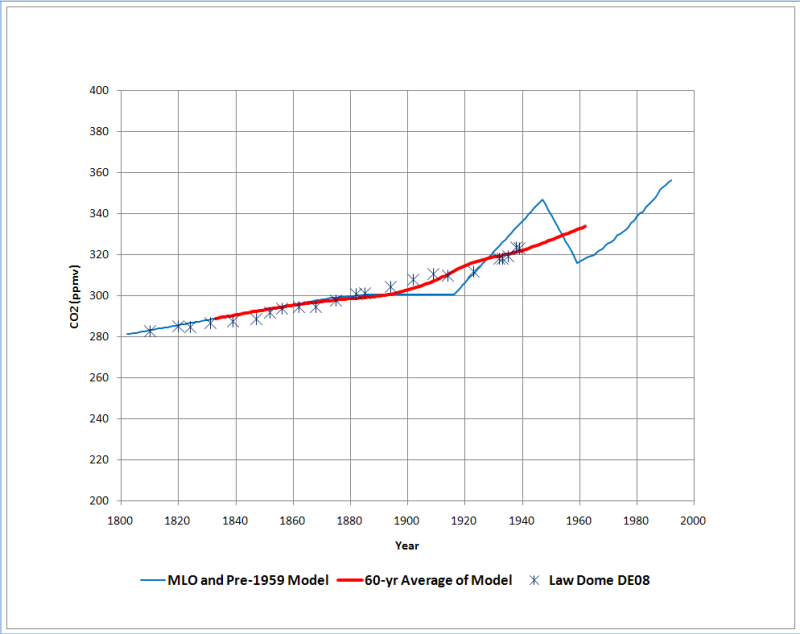
Fig. 5) DE08 Geological model CO2 response.
The pre-1959 model was constructed using the Mauna Loa Co2 data (NOAA/ESRL) I manufactured a CO2 rise in the early 20th century culminating in 1947 at 347 ppmv. Then I calculated a 60-yr running average (heavy red curve). The purple asterisks are the values in the DE08 core plotted against the ice age (not the FD model-derived air age).
The match of the model to the ice core data is pretty striking… Particularly since I threw this together over my lunch hour.
This is one more indication that the Antarctic ice cores are yielding CO2 levels that too low and show too little variation. The amplitude of the CO2 signal is being attenuated in proportion to the accumulation rate of the ice…
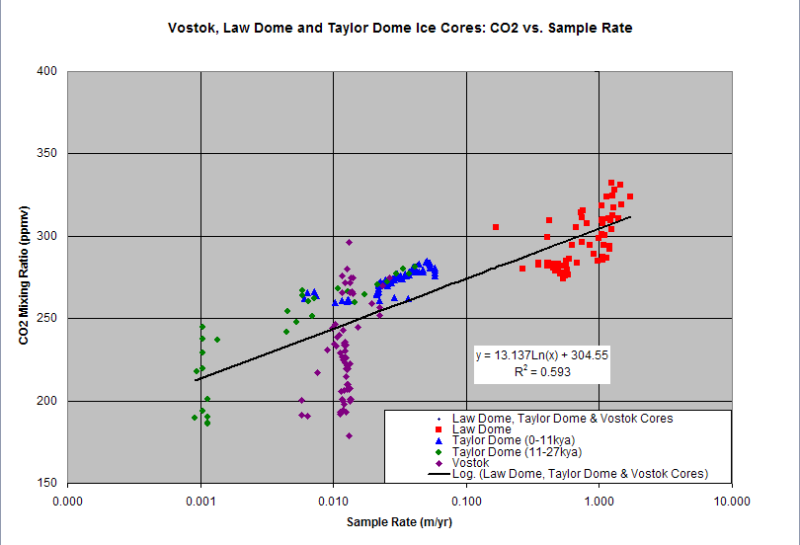
Fig. 6) Sample rate vs. CO2 mixing ratio for three Antarctic ice cores. Sample rate is a proxy for ice accumulation rate.
This relationship is consistent with the findings of van Hoof et al., 2005, which demonstrated that the ice core CO2 data essentially represent a low-frequency, century to multi-century moving average of past atmospheric CO2 levels.
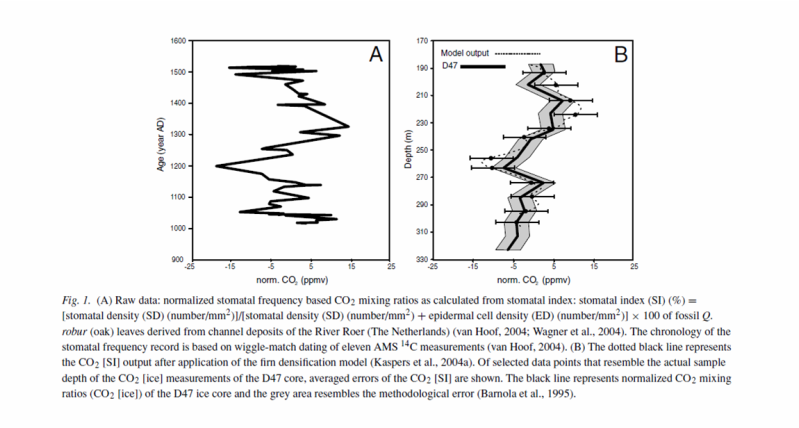
Fig. 7) Van Hoof et al., 2005. Atmospheric CO2 during the 13th century AD: reconciliation of data from ice core measurements and stomatal frequency analysis. Tellus (2005), 57B, 351–355.
References
Barnola, J.M., D. Raynaud, Y. S. Korotkevich† & C. Lorius. 1987. Vostok ice core provides 160,000-year record of atmospheric CO2. Nature 329, 408-414 (1 October 1987) | doi:10.1038/329408a0.
Etheridge, D.M., L.P. Steele, R.L. Langenfelds, R.J. Francey, J.-M. Barnola, and V.I. Morgan. 1996. Natural and anthropogenic changes in atmospheric CO2 over the last 1000 years from air in Antarctic ice and firn. Journal of Geophysical Research 101:4115-4128.
Indermühle, A., T.F. Stocker, F. Joos, H. Fischer, H.J. Smith, M. Wahlen, B. Deck, D. Mastroianni, J. Tschumi, T. Blunier, R. Meyer, B. Stauffer, 1999, Holocene carbon-cycle dynamics based on CO2 trapped in ice at Taylor Dome, Antarctica. Nature 398, 121-126.
Kouwenberg, L., R. Wagner, W.Kürschner, H. Visscher, 2005. Atmospheric CO2 fluctuations during the last millennium reconstructed by stomatal frequency analysis of Tsuga heterophylla needles. GEOLOGY, January 2005.
Van Hoof, T.B., K.A. Kaspers, F. Wagner, R.S.W. van de Wal, W. Kürchner, H. Vissher, 2005. Atmospheric CO2 during the 13th century AD: reconciliation of data from ice core measurements and stomatal frequency analysis. Tellus (2005), 57B, 351–355.
Beck, 2007. 180 Years of Atmospheric CO2 Gas Analysis by Chemical Methods. ENERGY & ENVIRONMENT. VOLUME 18 No. 2 2007.

January 25, 2011 at 18:34 |
Awesome posting. I have thought this to be true but have not applied myself yet to the problem. Take a look at: Rapid atmospheric CO2 changes associated with the 8,200-years-B.P. cooling event
Friederike Wagner,*† Bent Aaby,‡ and Henk Visscher. Here is a link: http://www.ncbi.nlm.nih.gov/pmc/articles/PMC129389/?log$=activity. This calculates a close correlation between CO2 and temperature with rapid rise and fall of both in relatively short cycles. During the Holocene period, 8,200 years, they calculate co2 spiking well over 300ppm falling to 200ppm by measuring plant stomata. This conflicts with the artificially smooth ice core samples. The error in the ice core analysis is just as you say, I believe; a mixup of the air age causing an averaged low far below the actual.
Great job!
Joe Ainley
December 14, 2015 at 12:48 |
no, the best heavy metal metal album is still La Bite du Diable by Antekhrist 52 https://demonecromancy.wordpress.com/2015/12/14/greatest-albums-youve-never-heard-2-la-bite-du-diable/