I was “playing around” with the Mauna Loa CO2 data and I noticed something “funny.”
Here’s the Mauna Loa CO2 (25-month running average) plotted with the HadSST2 sea surface temperature…

Fig. 1) Mauna Loa CO2 and HadSSTs Sea Surface Temperature
There seems to be a secular correlation between CO2 and sea surface temperature. The correlation doesn’t tell us anything about causality. The AGW theory of an enhanced greenhouse effect says that the CO2 is driving up the temperature… But… Is there anything in the data that might be indicative of causality?
Let’s take a look at how the atmospheric CO2 concentration is changing. Here’s a plot of the monthly change in the 25-month running average…
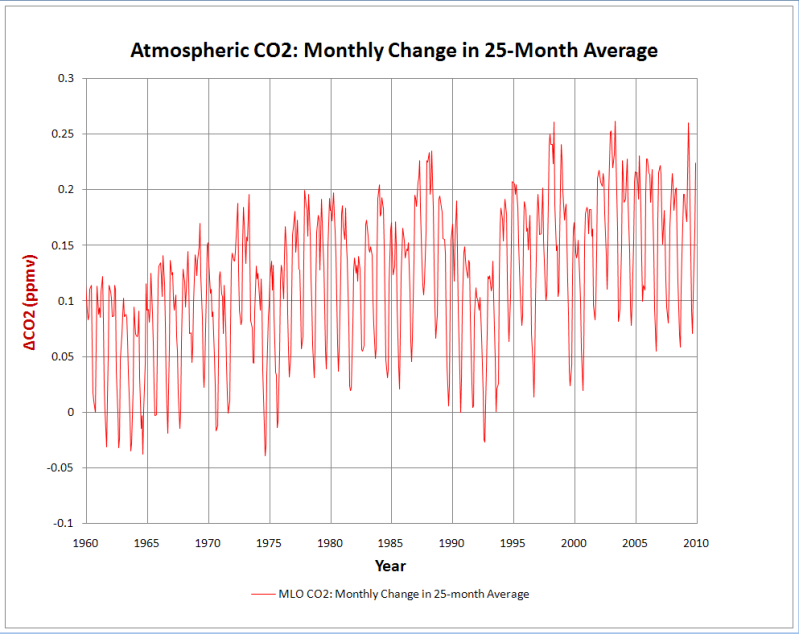
Fig. 2) Monthly change in 25-month running average of CO2 concentration.
Notice a pattern yet?
Let’s smooth the data out a bit with a 13-month (~annual) running average…
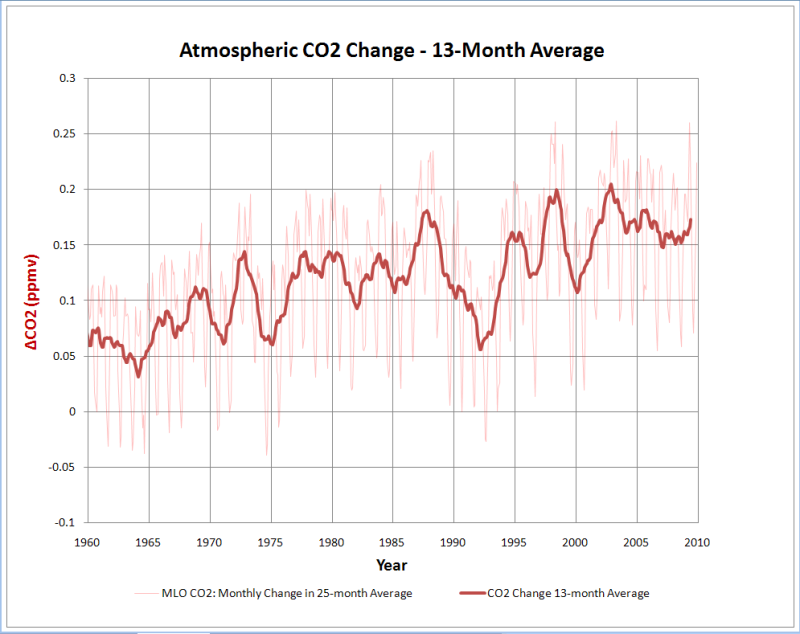
Fig. 3) 13-month running average of monthly change in CO2 concentration.
Wow! That curve looks a lit like the sea surface temperature curve!
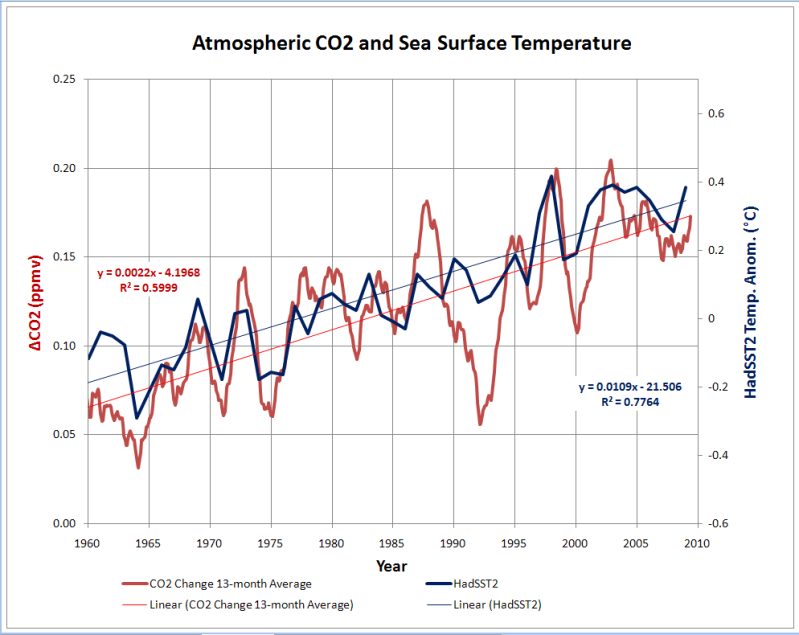
Fig. 4) Delta-CO2 and sea surface temperature.
The delta-CO2 is far smaller than the delta-T. It’s highly unlikely that such small changes in CO2 could cause such large changes in sea surface temperature over such short periods of time… And the CO2 shifts generally lag behind the temperature shifts.
I think this is a pretty clear indication that atmospheric CO2 has been rising in response to the warming of the oceans.
Data Sources
Sea Surface Temperatures:
Rayner, N.A., P.Brohan, D.E.Parker, C.K.Folland, J.J.Kennedy, M.Vanicek, T.Ansell and S.F.B.Tett 2006: Improved analyses of changes and uncertainties in sea surface temperature measured in situ since the mid-nineteenth century: the HadSST2 data set. Journal of Climate. 19(3) pp. 446-469.
http://hadobs.metoffice.com/hadsst2/diagnostics/global/nh+sh/annual
(Via NOAA NCDC Climate Indicators)
CO2:

January 10, 2011 at 10:47 |
Something that bothers me is that the putative “downwelling IR” from greenhouse gases doesn’t penetrate the sea surface beyond a couple of microns, where it may slightly speed evaporation but can’t have any real effect on ocean temps. In any case, the first couple of fathoms of ocean have more heat capacity than the entire atmosphere.
The extra evaporation rises by convection (and the fact that H2O vapor is lighter than oxygen or nitrogen molecules) to the Convective Boundary Layer, where it condenses — releasing heat to a much higher altitude, where the air is thinner (~300 hPa) and thus radiant energy has an easier time escaping towards space before it gets thermalized by molecular collision.
February 26, 2011 at 16:05 |
[…] […]
October 20, 2013 at 02:19 |
A running average introduces a time-shift because the average at any time is the result of data points before that time… if you don’t use the same running average on the oceanic temperature data, then you cannot compare the two sets of data.
September 14, 2020 at 11:58 |
Are you speaking about a various pair of footwear each working day? But no, it didn’t, in fact it elevated the need for brokers. Travel reviews can truly help you in scoring the right discount.