An excellent post over at Watts Up With That?, Devastating non-trends in US Climate, inspired me to take a look at some recent trends (or lack thereof) in US drought conditions. I visited the U.S. Drought Monitor website and downloaded a drought condition table from January 1, 2000 to January 1, 2010; and here’s what I found…

U.S. Drought Conditions (Lower 48, 2000-2010)
The area of the contiguous United States experiencing severe drought conditions (D2-D4) has declined sharply over the last decade. The area experiencing mild drought conditions (D0-D2) has no trend. And the area with no drought conditions has increase by ~10%.
The U.S. Drought Monitor is located at the University of Nebraska-Lincoln. It is a joint operation of the USDA, NOAA and the University of Nebraska-Lincoln.
Here is today’s drought monitor map…

Funny thing… The recent spate of global warming since 1976, kicked off when the PDO switched from negative to positive mode. Sine 2003, the PDO has switched back to negative mode…
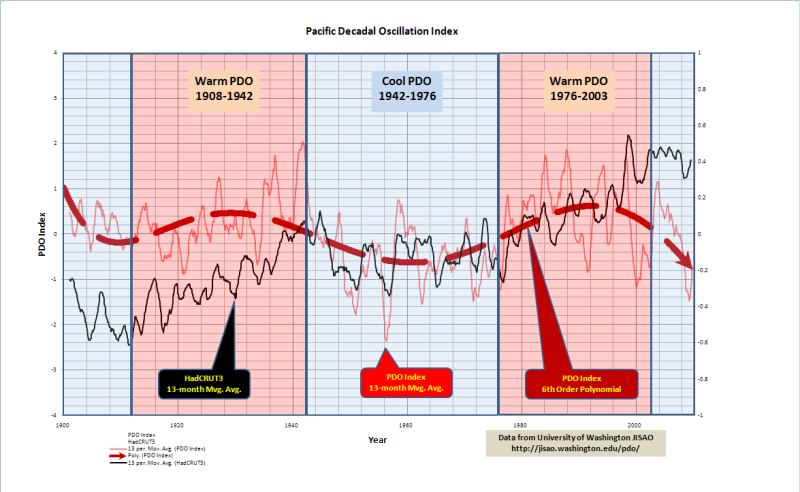
PDO Phase Correlation With HadCRUT3
Since the PDO switch, we have had a slight cooling trend. This even shows up in the HadCRUT 3 surface data…
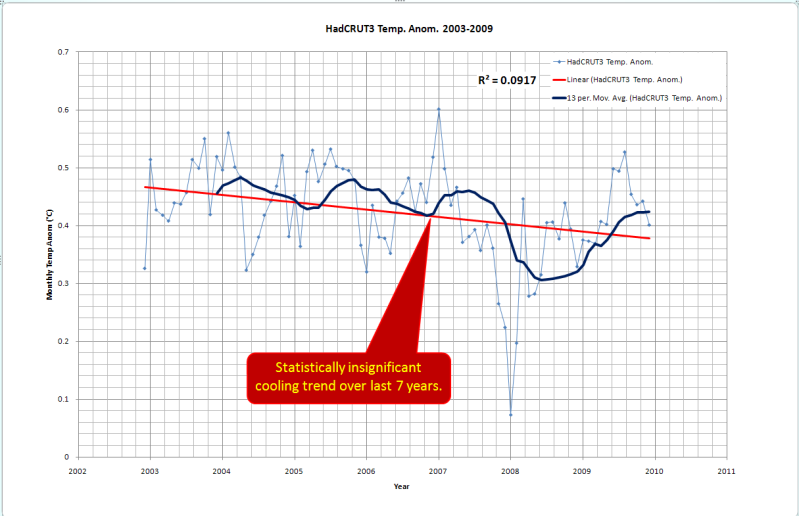
HadCRUT3 shows cooling trend since 2003.
Since 2003, over all drought conditions in the US have improved sharply. Lake Powell has often been misused by the warmistas as a poster child for the AGW-driven drought that was supposed to devastate the American Southwest. But, a funny thing has been happening since 2004…
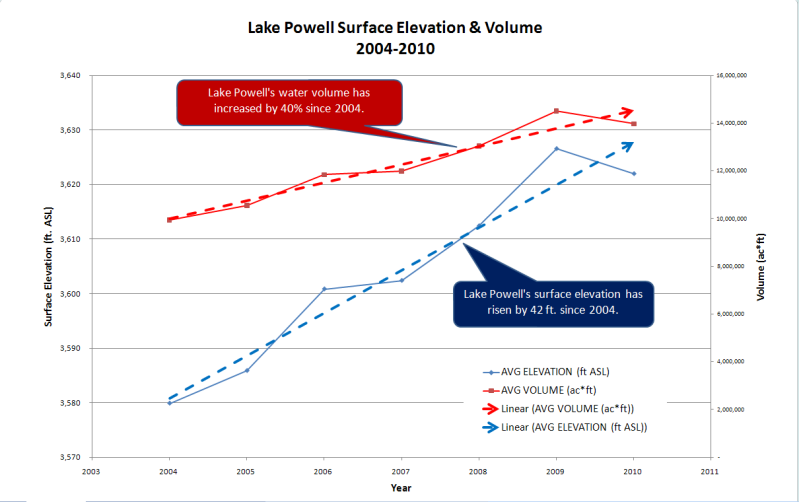
Lake Powell Surface Elevation and Water Volume
Lake Powell has been accumulating water… As have most of the other major lakes along the Colorado River…
| 2010 Volume (ac*ft) | Change Since 2004 | |
| Lake Powell | 13,973,782 | 40% |
| Lake Mead | 11,526,039 | -21% |
| Flaming Gorge | 3,204,118 | 21% |
| Lake Navajo | 1,225,531 | 37% |
| Lake Havasu | 573,714 | 1% |
| Blue Mesa | 556,406 | 13% |
Only Lake Mead has shown a decline in water volume since 2004. The total volume of all six lakes has increased by 7% since 2004.
I’m sure that the IPCC and its apologists can rationalize this lack of climate change just as well as they have rationalized the lack of statistically significant global warming since 2004.

October 19, 2012 at 14:05 |
[…] is a comparison of JISAO’s PDO index (red) with the HadCRUT3 temperature record […]