Answer: Nothing out of the ordinary.
This latest gaff from Al Gore inspired me to take a look at climate change in Greenland…
Inconvenient truth for Al Gore as his North Pole sums don’t add up
[…]
In his speech, Mr Gore told the conference: “These figures are fresh. Some of the models suggest to Dr [Wieslav] Maslowski that there is a 75 per cent chance that the entire north polar ice cap, during the summer months, could be completely ice-free within five to seven years.”
However, the climatologist whose work Mr Gore was relying upon dropped the former Vice-President in the water with an icy blast.
“It’s unclear to me how this figure was arrived at,” Dr Maslowski said. “I would never try to estimate likelihood at anything as exact as this.”
[…]
Perhaps Mr Gore had felt the need to gild the lily to buttress resolve. But his speech was roundly criticised by members of the climate science community. “This is an exaggeration that opens the science up to criticism from sceptics,” Professor Jim Overland, a leading oceanographer at the US National Oceanic and Atmospheric Administration said.
“You really don’t need to exaggerate the changes in the Arctic.”
[…]
Richard Lindzen, a climate scientist at the Massachusets Institute of Technology who does not believe that global warming is largely caused by man, said: “He’s just extrapolated from 2007, when there was a big retreat, and got zero.”
There’s not a whole lot in the way of temperature records from the Arctic ice cap… No permanent weather stations nor any millennial-scale ice cores… But there are a lot of temperature data from Greenland… A few weather stations, a few ice cores and a least a couple of ice boreholes.
Let’s look at the GISP 2 ice core, the DYE-3 & GRIP boreholes and the surface temperature records from Egedesminde & Jakobshavn.
GISP 2 and DYE-3 are identified on the map below, GRIP is just to the east of GISP2 and Egedesminde & Jakobshavn are on the west coast (due west of Milcent)…

NOAA’s NCDC has a library of borehole temperature data… LINK
The resolution of the borehole data is a function of depth (just like any other subsurface imaging method, like seismic reflection data); so the frequency of borehole temperature data decreases with depth – Higher frequency cycles can only be imaged in shallower (younger) sediments. Borehole temperature data lose resolution with depth (age). This is a measurement of heat flow. Over time, heat flows from warm places to cool places. Shallower (younger) sections of boreholes have far higher temporal resolution than the deeper (older) sections of boreholes. Oxygen isotope ratios (d18O) don’t have the same resolution issue; but they are not useful if firn or snow. They have very close to annual temperature resolution in ice layers as far back as several thousand years ago. In the case of the GISP2 core, the most recent ice was from the late 1800’s. The glacial section above it was still composed of snow and firn.
Borehole temperatures have an advantage over the d18O from ice cores in that they record temperatures all the way up to the present; but there is a loss of resolution with depth.
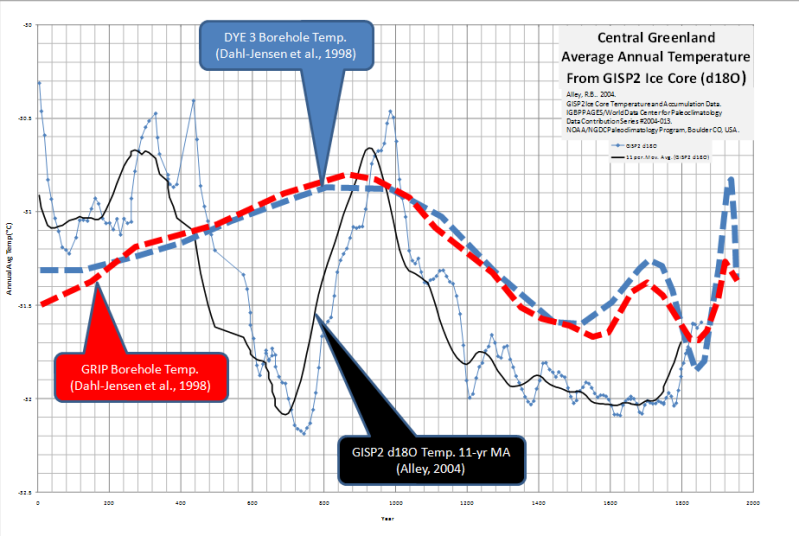
I haven’t been able to find the Dahl-Jensen DYE 3 borehole data; but I did find Alley’s GISP2 data. I plotted the GISP2 data and digitized the borehole curves onto the plot. The difference in temporal resolution of the two data sets around 1000 AD is obvious…
I then digitized the DYE 3 curve on a plot of two instrumental stations from 1880-2009…

In both cases the borehole data approximate the low-frequency component of the higher frequency d18O and instrumental data.
Borehole temperatures show that the Medieval Warm Period and 1920-1940 were warmer than the late 1990’s.
In no case is there anything anomalous about temperature changes in Greenland in the 20th century vs the prior 2,000 years; nor is there anything anomalous about the late 20th century to early 21st century relative to the early 20th century.
The Medieval Warm Period is part of a 1,470-yr (+/- 500-yr) cycle that is identified in ice cores (Dansgaard-Oeschger Events) and marine sediment cores (Heinrich and Bond Events) and linked to variations of the 87- and 210-yr solar cycles. It’s also very obvious in borehole data; yet the Climategate Crew keeps trying to erase it from the paleoclimatological record.
References:
Alley, R.B.. 2004. GISP2 Ice Core Temperature and Accumulation Data. IGBP PAGES/World Data Center for Paleoclimatology Data Contribution Series #2004-013.
NOAA/NGDC Paleoclimatology Program, Boulder CO, USA.
Alley, R.B. 2000.
The Younger Dryas cold interval as viewed from central Greenland.
Quaternary Science Reviews 19:213-226.
D. Dahl-Jensen, K. Mosegaard, N. Gundestrup, G. D. Clow, S. J. Johnsen, A. W. Hansen, N. Balling
Past Temperatures Directly from the Greenland Ice Sheet
Science 9 October 1998: 268
DOI: 10.1126/science.282.5387.268

September 9, 2014 at 13:06 |
Wow, that’s what I was exploring for, what a data!
existing here at this weblog, thanks admin of
this site.