| Table 1.1. Net Generation by Energy Source: Total (All Sectors), 2007-February 2017 | |||||||
| (Thousand Megawatthours) | |||||||
| Generation at Utility Scale Facilities | Small Scale Generation | ||||||
| Coal | Natural Gas | Nuclear | Hydroelectric | Solar | Solar PV | Total Solar | |
| 2014 | 1,581,710 | 1,126,609 | 797,166 | 259,367 | 17,691 | 11,233 | 28,924 |
| 2015 | 1,352,398 | 1,333,482 | 797,178 | 249,080 | 24,893 | 14,139 | 39,032 |
| 2016 | 1,240,108 | 1,380,295 | 805,327 | 265,829 | 36,754 | 19,467 | 56,221 |

| % Natural | TCR (° C) | ECS (° C) |
| 0% | 1.35 | 1.75 |
| 25% | 1.01 | 1.31 |
| 50% | 0.68 | 0.88 |
| 75% | 0.34 | 0.44 |
| 100% | 0.00 | 0.00 |

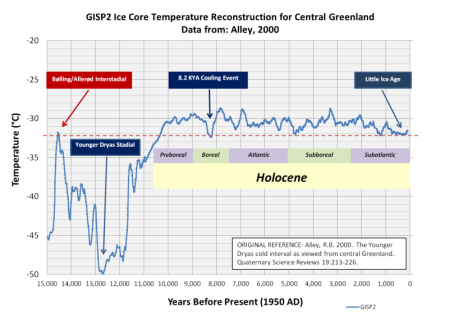
Figure 11. The Holocene climate has been dominated by a millennial scale climate cycle.
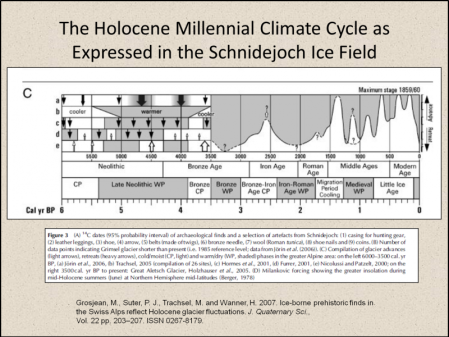
Figure 10. The millennial scale climate cycle can clearly be traced back to the end of the Holocene Climatic Optimum and the onset of the Neoglaciation.
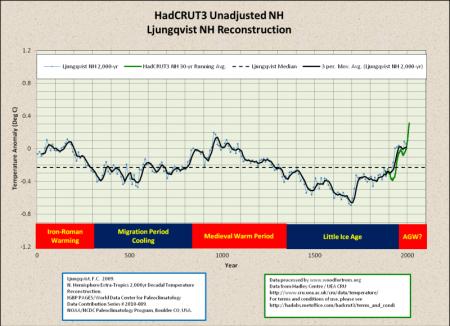
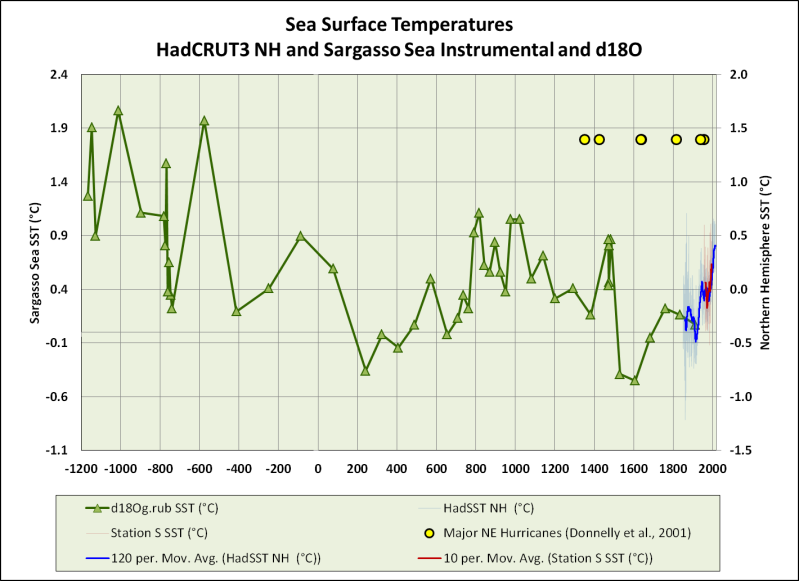
Figure 12. Late Holocene climate cycles (quasi-periodic fluctuations).

Figure 11. Millennial scale cycle apparent on Moberg reconstruction.

Leave a comment