Archive for the ‘WUWT’ Category

Science Lessons for Secretary of State John F. Kerry

March 16, 2015

Secretary of State John F. Kerry’s recent remarks on climate change at the Atlantic Council were so scientifically illiterate that I find it difficult to believe that he managed to barely get a D in geology at Yale University.  As a US citizen and geoscientist, I feel it is my patriotic and professional duty to provide Secretary Kerry with a few complimentary science lessons.

Let’s start with some basics

So stop for a minute and just think about the basics. When an apple falls from a tree, it will drop toward the ground. We know that because of the basic laws of physics. Science tells us that gravity exists, and no one disputes that. Science also tells us that when the water temperature drops below 32 degrees Fahrenheit, it turns to ice. No one disputes that.

So when science tells us that our climate is changing and humans beings are largely causing that change, by what right do people stand up and just say, “Well, I dispute that” or “I deny that elementary truth?” And yet, there are those who do so.

http://m.state.gov/md238829.htm

Well Mr. Secretary… The Theory of Gravity can be empirically tested with such repeatability that it has become a Law and can be expressed with a simple equation… It can even be tested and  confirmed on the Moon…

The freezing point of water (phase transition) can also be empirically tested and demonstrated with ample repeatability. However, the freezing point of water is not always 32°F. The freezing point is dependent on both temperature and pressure….

We do not accept gravity and phase transition because science tells us to. We accept these things because they can be empirically tested, repeatedly confirmed and form the bases of solid scientific theories.

Science tells us that climate has always changed and always will be changing. While the radiative forcing effect of CO2 is kind of in the same ballpark as the freezing point of water, the notion that humans are the primary cause of recent climate changes is nothing but a hypothesis which has failed almost every empirical test. This is why many scientists do not accept that this is “settled science.”

From Remote Sensing Systems [with my commentary]:

Over the past decade, we have been collaborating with Ben Santer at LLNL (along with numerous other investigators) to compare our tropospheric results with the predictions of climate models. Our results can be summarized as follows:

  • Over the past 35 years, the troposphere has warmed significantly. The global average temperature has risen at an average rate of about 0.13 degrees Kelvin per decade (0.23 degrees F per decade).[All of the warming occurred in one step-shift in the late 1990’s.]
  • Climate models cannot explain this warming if human-caused increases in greenhouse gases are not included as input to the model simulation.[Only because climate models are programmed to do so. The models are programmed with very high sensitivities to CO2. Then they are paramaterized (fudged) with assumptions about albedo effects of past anthropogenic aerosol emissions in order to retrocast past temperature changes. The climate models almost totally fail to incorporate cloud albedo effects and natural climate oscillations.This is why they lack predictive skill.
  • The spatial pattern of warming is consistent with human-induced warming. See Santer et al 2008, 2009, 2011, and 2012 for more about the detection and attribution of human induced changes in atmospheric temperature using MSU/AMSU data.[Yep. Most of the warming is occurring at night and in the coldest air masses in the Northern Hemisphere.]

But….

  • The climate has not warmed as fast as almost all climate models predict.

[Because the models lack predictive skill.]

To illustrate this last problem, we show several plots below. Each of these plots has a time series of TLT temperature anomalies using a reference period of 1979-2008. In each plot, the thick black line is the measured data from RSS V3.3 MSU/AMSU Temperatures. The yellow band shows the 5% to 95% envelope for the results of 33 CMIP-5 model simulations (19 different models, many with multiple realizations) that are intended to simulate Earth’s Climate over the 20th Century.

[…]

[…]

http://www.remss.com/research/climate

RSS shows no warming since 1997…

In fairness, the models have demonstrated precision. They precisely miss the mark to the high side…

The first modern AGW model from 1988 has essentially proven that the climate is relatively insensitive to increasing atmospheric CO2. Subsequent models have confirmed that the hypothesis is wrong…

James Hansen, formerly of NASA-GISS, first proved that AGW was wrong 27 years ago. 

Back in 1988, he published a climate model that, when compared to his own temperature data, substantially disproves AGW…

GISTEMP has tracked the Hansen scenario in which a green utopia was achieved more than a decade ago.

Hansen’s model used an equilibrium climate sensitivity (ECS) of 4.2°C per doubling of pre-industrial CO2. The IPCC “consensus” is 3.0°C. Numerous recent papers have demonstrated that the ECS is less than 2.0°C. T

“Scenario B” might be the most relevant prediction because CH4 and CFC’s have followed closest to the “C” trajectory, while CO2 has tracked “A”.

Since CO2 tracked “A”, CH4 and CFC’s tracked “C” and temperature tracked below “C”… The atmosphere is far less sensitive to CO2 than Hansen modeled… The atmosphere was essentially insensitive to the ~50ppmv rise in CO2 over the last 24 years.

The following CMIP5 model was parameterized (fudged) to accurately retrocast HadCRUT4 from 1950-2004.

Within eight years, the observed temperature is on the verge of dropping out of the lower error band.

This model from Kaufmann et al., 2011 simulated natural and anthropogenic (primarily CO2) forcing mechanisms from 1999-2008. Natural forcing won by a score of 3-1.

A plot of the Wood for Trees Temperature Index on 12 years worth of IPCC model suites demonstrates that the AGW hypothesis has demonstrated no predictive skill in nearly 30 years of testing…

On to basic math and reading skills

Now folks, we literally do not have the time to waste debating whether we can say “climate change.” We have to talk about how we solve climate change. Because no matter how much people want to bury their heads in the sand, it will not alter the fact that 97 percent of peer-reviewed climate studies confirm that climate change is happening and that human activity is largely responsible.

Well Mr. Secretary… The SkepSci bloggers who claimed the bogus 97% consensus don’t even assert that “97 percent of peer-reviewed climate studies confirm that climate change is happening and that human activity is largely responsible.”

 The fact.is that less than 1% “of peer-reviewed climate studies confirm that climate change is happening and that human activity is largely responsible.”

Now for a bit of history

Just look around you. Fourteen of the fifteen warmest years on record in all of history have occurred since 2000, in all of recorded history. Last year was the warmest of all. And I think if you stop and think about it, it seems that almost every next year becomes one of the hottest on record.

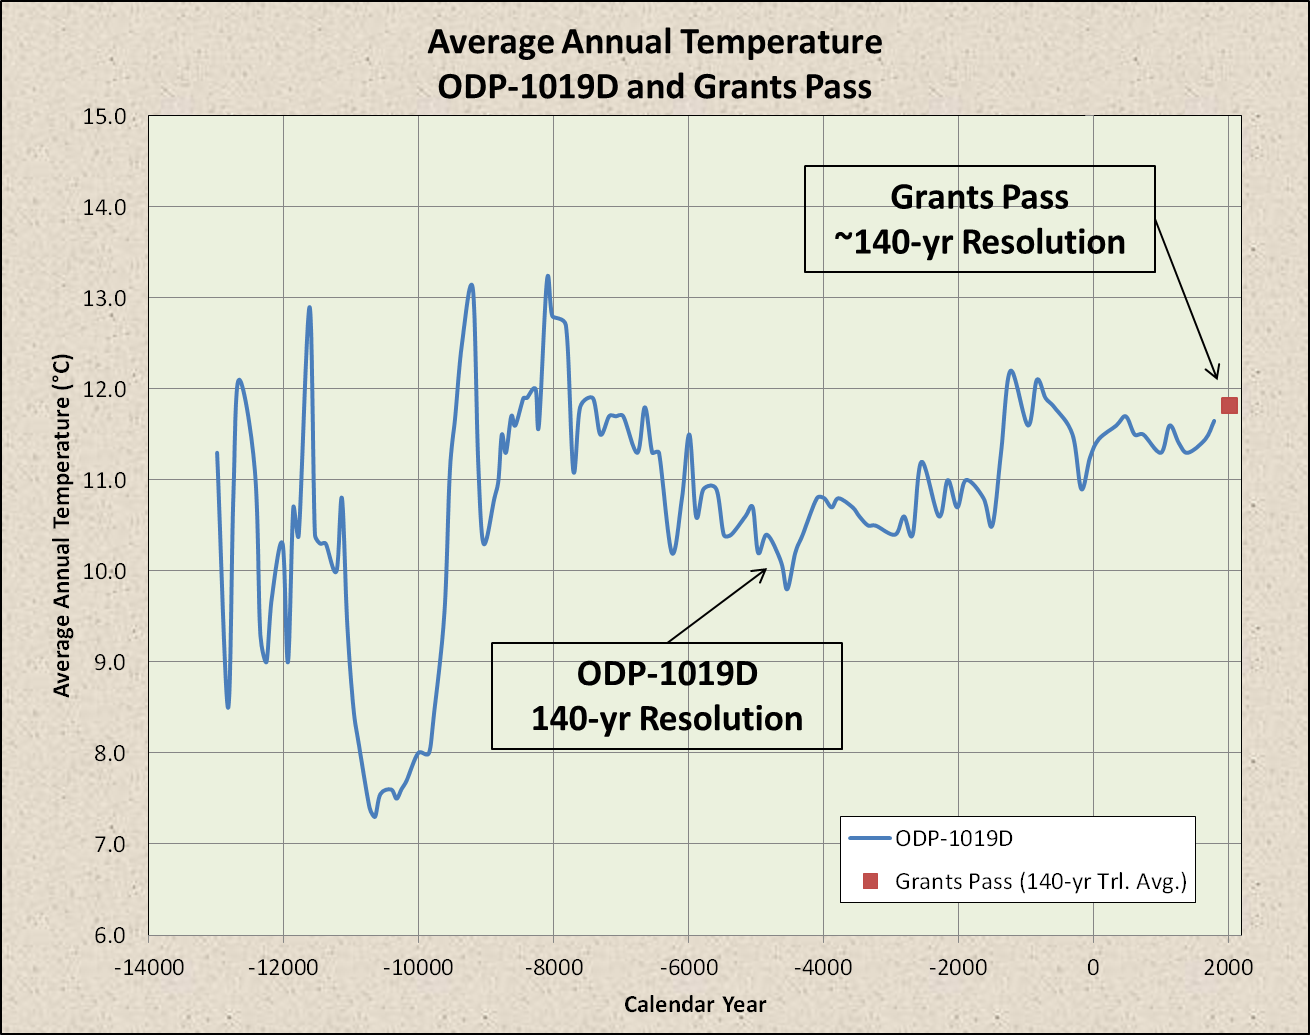
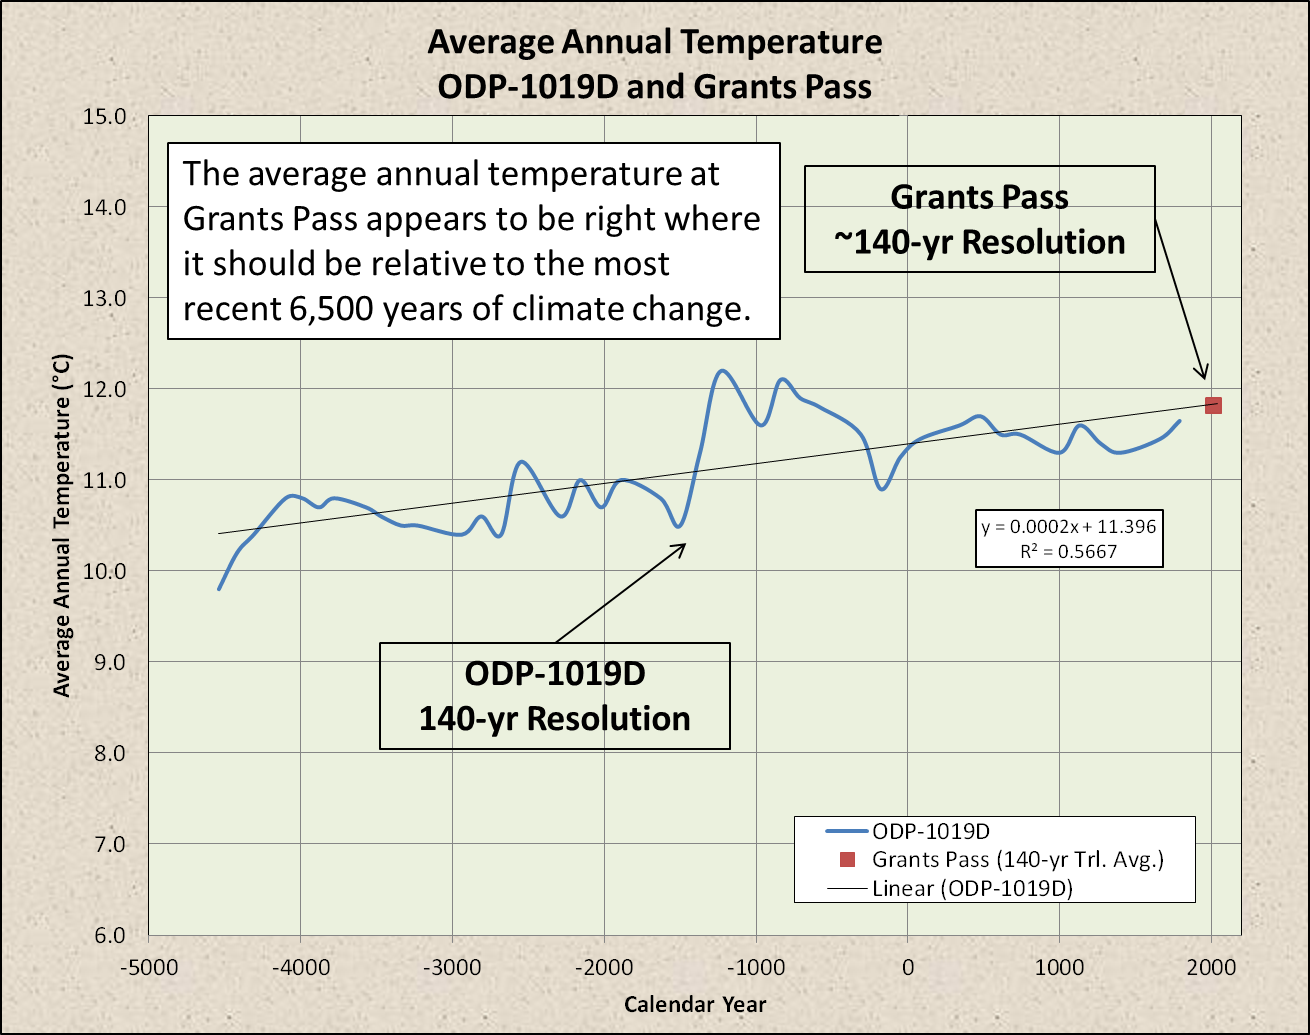
Wrong again, Mr. Secretary. While it is possible that “fourteen of the fifteen warmest years on record (since about 1850) have occurred since 2000″… “all of recorded history” goes back a bit farther than that.  Recorded history goes back a time long before this 2,000 year climate reconstruction…

ftp://ftp.ncdc.noaa.gov/pub/data/paleo/contributions_by_author/ljungqvist2010/ljungqvist2010.txt

And now back to basic science

It’s not particularly complicated. I don’t mean to sound haughty, but think about it for a minute. Life on Earth would not exist without a greenhouse effect. That is what has kept the average temperature up, until recently, at 57 degrees Fahrenheit, because there is this greenhouse effect. And it was called the greenhouse effect because it does exactly what a greenhouse does. When the sun pours in and bounces off at a different angle, it goes back up at a different angle. That can’t escape, and that warms things – a very simple proposition.

Don’t worry Mr. Secretary… You don’t sound haughty. You sound like a guy who got a D in geology and would have gotten an F in physics.

Neither a greenhouse nor the greenhouse effect rely on the Law of Reflection or Snell’s Law… Nor does the greenhouse effect even behave like a greenhouse…

The greenhouse effect refers to circumstances where the short wavelengths of visible light from the sun pass through a transparent medium and are absorbed, but the longer wavelengths of the infrared re-radiation from the heated objects are unable to pass through that medium. The trapping of the long wavelength radiation leads to more heating and a higher resultant temperature.

[…]

A major part of the efficiency of the heating of an actual greenhouse is the trapping of the air so that the energy is not lost by convection. Keeping the hot air from escaping out the top is part of the practical “greenhouse effect”, but it is common usage to refer to the infrared trapping as the “greenhouse effect” in atmospheric applications where the air trapping is not applicable.

http://hyperphysics.phy-astr.gsu.edu…mo/grnhse.html

Summary

The laws and theories of gravity and phase transition are not even remotely analogous to the fatally flawed AGW hypothesis.

97% of peer-reviewed climate studies do not conclude that humans are largely to blame for recent climate changes.

There is no evidence that 14 of the last 15 years are the warmest in all of recorded history.

A greenhouse works by retarding convective cooling.  The greenhouse effect works by retarding radiative cooling.  Secretary Kerry’s lack of scientific literacy will work by retarding our economy.

A Geological Perspective on the “Irreversible Collapse” of the West Antarctic Ice Sheet

May 17, 2014

It’s “old” news…

Figure 1 Map showing dated locations used to resolve Holocene grounding-line retreat to its present position in the Ross Sea Embayment. Although the detailed structure of past grounding-line positions is unknown, dotted lines show the simplest grounding-line pattern consistent with the dates in the text. (Conway et al., 1999)

Figure 1
“Map showing dated locations used to resolve Holocene grounding-line retreat to its present position in the Ross Sea Embayment. Although the detailed structure of past grounding-line positions is unknown, dotted lines show the simplest grounding-line pattern consistent with the dates in the text.”
(Conway et al., 1999)

The history of deglaciation of the West Antarctic Ice Sheet (WAIS) gives clues about its future. Southward grounding-line migration was dated past three locations in the Ross Sea Embayment. Results indicate that most recession occurred during the middle to late Holocene in the absence of substantial sea level or climate forcing. Current grounding-line retreat may reflect ongoing ice recession that has been under way since the early Holocene. If so, the WAIS could continue to retreat even in the absence of further external forcing…

The collapse (retreat of the grounding line) began about 20,000 years ago. It is irreversible because “the WAIS could continue to retreat even in the absence of further external forcing” and there are no topographic obstacles to prevent it from flowing downhill into the ocean.

One has to wonder why this paper didn’t merit panic+stricken headlines in 1999

It’s the same story, just from the other side of the peninsula.


Reference
H. Conway et al, 1999. Past and Future Grounding-Line Retreat of the West Antarctic Ice Sheet. Science 8 October 1999: Vol. 286 no. 5438 pp. 280-283
DOI: 10.1126/science.286.5438.280

(Full text available with registration.)

Oh Say Can You See… Modern Sea Level Rise From a Geological Perspective?

December 19, 2013

Experts say the IPCC underestimated future sea level rise

A new study surveys 90 sea level rise experts, who say sea level rise this century will exceed IPCC projections
Wednesday 4 December 2013

John Abraham

It looks like past IPCC predictions of sea level rise were too conservative; things are worse than we thought. That is the takeaway message from a new study out in Quaternary Science Reviews and from updates to the IPCC report itself. The new study, which is also discussed in depth on RealClimate, tries to determine what our sea levels will be in the future. What they found isn’t pretty.

[…]

According to the best case scenario (humans take very aggressive action to reduce greenhouse gases), the experts think sea level rise will likely be about 0.4–0.6 meters (1.3–2.0 feet) by 2100 and 0.6–1.0 meters (2.0–3.3 feet) by 2300. According to the more likely higher emission scenario, the results are 0.7–1.2 meters (2.3–3.9 feet) by 2100 and 2.0–3.0 meters (6.5–9.8 feet) by 2300. These are significantly larger than the predictions set forth in the recently published IPCC AR5 report. They reflect what my colleagues, particularly scientists at NOAA, have been telling me for about three years.
[…]

The Guardian

Definition of climate “expert”: A parrot that can only say, “things are worse than we thought.”

The assertion of 0.7 to 1.2 meters (700-1200 mm) of sea level rise by 2100 is 100% unadulderated horse schist! This scenario would require an acceleration of sea level rise to a rate twice that of the Holocene Transgression and an average ice melt rate 24 times that of deglaciation. It is even highly unlikely that sea level will rise by as much as the ostensibly optimistic scenario (400-600 km).

A Geological Perspective of Recent Sea Level Rise

All of the estimated sea level rise since 1700 is represented by the light blue blob and dark blue line inside the black oval. Sea level isn’t doing anything now that it wasn’t already doing before All Gore invented global warming. And Holocene sea level changes have been insignificant relative to the Holocene transgression…
 
Figure 1. Sea 1evel rise since the late Pleistocene from Tahitian corals, tide gauges and satellite altimetry.
(more…)

Dave’s Top Ten Reasons Why the Oil Industry Doesn’t Spend its Billions on Disproving the Junk Science of AGW

December 14, 2013

Guest post by David Middleton

In my Internet “debates” with warmists, I occasionally encounter challenges like this…

We don’t yet not know the real global impact man has on the environment. It may be negligible. What we do know is that if the oil companies with their billions could disprove this manmade warming they could in an instance. They have not.

My response to this challenge is in the style of David Letterman…

Dave’s Top Ten Reasons Why the Oil Industry Doesn’t Spend its Billions on Disproving the Junk Science of AGW


10) It’s impossible to prove a negative.


9) The burden of proof is on those who wish to bankrupt these United States of America in order to reverse this…


8) The climate is always changing, always has, always will. There is absolutely no evidence that modern climate changes are exceeding the pre-human range of variability. There are anthropogenic influences which modify the climate’s natural oscillations. Very few scientists in the oil industry doubt that anthropogenic activities affect the climate. We just know for a fact that those effects are not causing the climate to change in ways that exceed the normal variability of the Holocene and that such effects are likely to be so small that they can’t be differentiated. Otherwise, the Warmists would have long ago clearly differentiated the anthropogenic from the natural. Furthermore, none of the proposed solutions are economically feasible, nor would they mitigate climate change in any measurable way.


7) The “oil industry” is composed of corporations engaged in the various aspects of oil & gas exploration, drilling and production. These corporations are owned by people, usually shareholders, who invested their own money for the purpose of making a profit on the exploration, drilling and production for and of oil and natural gas. They didn’t invest their money in science projects, particularly not junk science projects.


6) We already have full time jobs. I do this as a hobby because it combines my professional skills as a geoscientist and 25 years of experience (out of nearly 33) working in a Quaternart-Upper Tertiary sedimentary basin, with my longtime interest in palaeoclimatology.


5) The Warmists have already proven that AGW is wrong. The lack of global warming since the late 1990’s forced them to morph “global warming” into “climate change,” “global weirding,” “global climate disruption,” and other temperature-neutral descriptions.


4) The Warmists have already proven that AGW is wrong – Part Deux. Every conceivable weather, health, agricultural, botanical, zoological and even geophysical incident is “consistent” with the Gorebotic AGW “theory.” Thus rendering their “theory” un-falsifiable and rendering it unscientific. Kevin Trenberth of NCAR even declared the no longer scientific theory to be un-falsifiable when he stated that the “null hypothesis” principle should be reversed for AGW.


3) The Warmists have already proven that AGW is wrong – Part Trois: That pesky climate sensitivity thing.  Gorebot Prime, James Hansen, formerly of NASA-GISS and now a full-time political activist, first proved that AGW was wrong 25 years ago and then delivered an endless stream of idiotic alarmism. Back in 1988, he published a climate model that, when compared to his own temperature data, substantially disproves AGW…


GISTEMP has tracked the Hansen scenario in which a greent@rd utopia was achieved more than a decade ago. Hansen’s model used an equilibrium climate sensitivity (ECS) of 4.2°C per doubling of pre-industrial CO2. The IPCC “consensus” is 3.0°C. The maximum physically possible ECS is 2.0°C. The maximum physically possible ECS, consistent with the observations, is 1.0°C. Recent papers have concluded that solar forcing has been underestimated by a factor of six and CO2 forcing is much lower than the so-called consensus estimate. “Scenario B” might be the most relevant prediction because CH4 and CFC’s have followed closest to the “C” trajectory, while CO2 has tracked “A”. If you look at the model results, there is little difference between “A” and “B” in 2010…

Hansen describes “A” as “business as usual” and “B” as a more realistic or “Lite” version of “business as usual.” “C” represents a world in which mankind essentially undiscovered fire in the year 2000. The actual satellite-measured temperature change since 1988 tracks below “C,”  with the monster ENSO of 1998 being the only notable exception…

Since CO2 tracked “A”, CH4 and CFC’s tracked “C” and temperature tracked below “C,” the atmosphere is far less sensitive to CO2 than Hansen modeled.  The atmosphere was essentially insensitive to the ~50ppmv rise in CO2 over the last 24 years. Hansen may have inadvertantly provided solid support for this “inconvenient truth.”


2) The Warmists have already proven that AGW is wrong – Part Quatre: A model of failure. Let’s give Gorebot Prime, Jimbo Hansen, a pass. His 1988 model reflected old science and old computers and surely the models have gotten better over the last quarter-century… Or not.

STILL Epic Fail: 73 Climate Models vs. Measurements, Running 5-Year Means June 6th, 2013 by Roy W. Spencer, Ph. D. […] In this case, the models and observations have been plotted so that their respective 1979-2012 trend lines all intersect in 1979, which we believe is the most meaningful way to simultaneously plot the models’ results for comparison to the observations. In my opinion, the day of reckoning has arrived. The modellers and the IPCC have willingly ignored the evidence for low climate sensitivity for many years, despite the fact that some of us have shown that simply confusing cause and effect when examining cloud and temperature variations can totally mislead you on cloud feedbacks (e.g. Spencer & Braswell, 2010). The discrepancy between models and observations is not a new issue…just one that is becoming more glaring over time. It will be interesting to see how all of this plays out in the coming years. I frankly don’t see how the IPCC can keep claiming that the models are “not inconsistent with” the observations. Any sane person can see otherwise. If the observations in the above graph were on the UPPER (warm) side of the models, do you really believe the modelers would not be falling all over themselves to see how much additional surface warming they could get their models to produce? Hundreds of millions of dollars that have gone into the expensive climate modelling enterprise has all but destroyed governmental funding of research into natural sources of climate change. […] Dr. Roy Spencer

[Assuming whiny Gorebot voice]… Oh… That tricky Roy Spencer. That’s just the tropics and it goes way back to 1979… That’s unfair! The science is verified! The models are right! Or not… The following CMIP5 model was parameterized (fudged) to accurately retrocast HadCRUT4 from 1950-2004. Eight years and out! Within eight years, the observed temperature is on the verge of dropping out of the lower error band. This model from Kaufmann et al., 2011 simulated natural and anthropogenic (primarily CO2) forcing mechanisms from 1999-2008. Natural forcing won by a score of 3-1.   Although, the authors seem to have concluded that anthropogenic forcing related to global cooling were masking theanthropogenic forcing” related to global warming. This is to be expected because, obviously, the Earth’s climate was static prior to the incorporation of Standard Oil Company… Models are great heuristic tools; but they cannot and should never be used as substitutes for observation and correlation. I can build a valid computer model that tells me that a geopressured Cibicides opima sandstone at depth of 15,000′ should exhibit a Class 3 AVO response. If I drill a Class 3 AVO anomaly in that neighborhood, I will drill a dry hole. A little bit of observation and correlation would quickly tell me that productive geopressured Cibicides opima sandstones at depth of 15,000′ don’t exhibit Class 3 AVO anomalies. 99% of petroleum geologists and exploration geophysicists would laugh you out of the room if you seriously thought a model was superior to actual observations. 2) The Warmists have already proven that AGW is wrong – Part Cinq: That pesky climate sensitivity thing – Subpart Deux. In our last episode of climate sensitivity, we reviewed Jimbo Hansen’s spectacularly wrong Equilibrium Climate Sensitivity of 4.2 °C. Now we will move on the current alleged consensusECS of 3.3 (±1.1) °C (Nothing like a 33% error bar to instill confidence!)…

The equilibrium climate sensitivity values for the AR4 AOGCMs coupled to non-dynamic slab ocean models are given for comparison (Box 10.2, Figure 1e,f; see also Table 8.2). These estimates come from models that represent the current best efforts from the international global climate modelling community at simulating climate. A normal fit yields a 5 to 95% range of about 2.1°C to 4.4°C with a mean value of equilibrium climate sensitivity of about 3.3°C (2.2°C to 4.6°C for a lognormal distribution, median 3.2°C) (Räisänen, 2005b). 

For good measure, the consensus-teers of the IPCC toss in this bit of gratuitous alarmism…

Studies comparing the observed transient response of surface temperature after large volcanic eruptions with results obtained from models with different climate sensitivities (see Section. 9.6) do not provide PDFs, but find best agreement with sensitivities around 3°C, and reasonable agreement within the 1.5°C to 4.5°C range (Wigley et al., 2005). They are not able to exclude sensitivities above 4.5°C. 

This explains the Gorebotic caterwauling from Climategate University

“Our research predicts that climate change will greatly reduce the diversity of even very common species found in most parts of the world. This loss of global-scale biodiversity would significantly impoverish the biosphere and the ecosystem services it provides…

[…] The good news is that our research provides crucial new evidence of how swift action to reduce CO2 and other greenhouse gases can prevent the biodiversity loss by reducing the amount of global warming to 2 degrees Celsius rather than 4 degrees.”

The Washington Post’s energy and environment inexpert

“The current level of action puts us on a pathway towards a 3.5–4°C warmer world by the end of this century.”

And Third World poverty pimps

The World Bank predicts that we are on track to a rise of 4 degrees Celsius in temperatures by the end of this century. This would mean a rise in sea levels of three to seven feet

There is not one single scrap of evidence that the current rate of emissions will lead to more than 2 °C warming (relative to 280 ppmv CO2) by 2100 (we’ll get to sea level in subsequent posts). Every recent observation-based estimate of the equilibrium climate sensitivity (ECS) to a doubling of the assumed pre-industrial CO2 level is in the range of 2 °C and roughly 1 °C of this has already occurred. Asten, 2012 found ECS to be 1.1 ± 0.4 °C based on δ18O and δ11B records from fossil forams and the Eocene-Oligocene transition in marine sediment cores from DSDP site 744. Earlier this year, researchers at CICERO and the Norwegian Computing Center announced that when they incorporated the temperature and CO2 data from 2000-2010 into their instrumental record-based ECS estimate, they obtain a most likely value of 1.9 °C. This work has yet to be published. Lewis, 2013 found a most likely ECS of 1.6 °K (same as C for these purposes) using a Bayesian analysis and incorporating recent data. Masters, 2013 found a most likely ECS of 1.98 °K from ocean heat content and sea surface temperature data… Aldrin et al, 2012 and Forster & Gregory, 2006 also found the ECS to most likely be less than 2 °C. Yet the IPCC, Climategate CRU and other alarmist ideologues continue to prattle on as if the ECS in the range of 4-5 °C or higher…


1) The joke is just too damn funny for us to spoil…

Obama’s global-warming folly By Charles Krauthammer, Published: July 4 The economy stagnates. Syria burns . Scandals lap at his feet. China and Russia mock him , even as a “29-year-old hacker” revealed his nation’s spy secrets to the world. How does President Obama respond? With a grandiloquent speech on climate change . Climate change? It lies at the very bottom of a list of Americans’ concerns (last of 21 — Pew poll). Which means that Obama’s declaration of unilateral American war on global warming, whatever the cost — and it will be heavy — is either highly visionary or hopelessly solipsistic. You decide: Global temperatures have been flat for 16 years — a curious time to unveil a grand, hugely costly, socially disruptive anti-warming program. Now, this inconvenient finding is not dispositive. It doesn’t mean there is no global warming. But it is something that the very complex global warming models that Obama naively claims represent settled science have trouble explaining. […] For the sake of argument, nonetheless, let’s concede that global warming is precisely what Obama thinks it is. Then answer this: What in God’s name is his massive new regulatory and spending program — which begins with a war on coal and ends with billions in more subsidies for new Solyndras — going to do about it? The United States has already radically cut carbon dioxide emissions — more than any country on earth since 2006, according to the International Energy Agency. Emissions today are back down to 1992 levels. And yet, at the same time, global emissions have gone up. That’s because — surprise! — we don’t control the energy use of the other 96 percent of humankind. […] Net effect: tens of thousands of jobs killed, entire states impoverished. This at a time of chronically and crushingly high unemployment, slow growth, jittery markets and deep economic uncertainty. But that’s not the worst of it. This massive self-sacrifice might be worthwhile if it did actually stop global warming and save the planet. What makes the whole idea nuts is that it won’t. This massive self-inflicted economic wound will have […] For a president to propose this with such aggressive certainty is incomprehensible. It is the starkest of examples of belief that is impervious to evidence. And the word for that is faith, not science. WaPo

Maryland’s “Wind Powered Welfare”

March 12, 2013

Going Green

Offshore Wind Passes in Senate, Gov. O’Malley’s Signature Next


The construction of a wind power farm off the coast of Ocean City could begin as early at 2017

By Jessica Wilde, Capital News Service

Gov. Martin O’Malley’s offshore wind energy bill is on its way to his desk for a signature, having passed in the House in February and in the Senate on Friday.

Five friendly Senate amendments are expected to be approved easily by the House.

The new legislation will funnel $1.7 billion of ratepayer subsidies over a 20-year period toward the construction of a wind power farm 10 to 30 miles off the coast of Ocean City as early as 2017.

“It’s about a better Maryland for tomorrow,” said Sen. James Mathias Jr., D-Worcester, the former mayor of Ocean City, who changed his vote to support the bill.

O’Malley’s previous two attempts to push the legislation—the first more ambitious —never made it to the Senate floor largely because of concerns about the cost to Marylanders.

His first initiative also failed because utility companies would have had to make nearly 20-year commitments to buy offshore wind energy.

[…]

GreenbeltPatch

Offshore wind is, by far, the most expensive source of electricity. An offshore wind farm would have to receive 34¢/kWh, wholesale, just to break even over a typical 30-yr plant lifetime. 34¢/kWh is almost three times the average retail residential electricity rate in the U.S.

(more…)

A Simple Test of Marcott et al., 2012

March 11, 2013

The Gorebots are al atwitter about this new paper…

Science 8 March 2013:
Vol. 339 no. 6124 pp. 1198-1201
DOI: 10.1126/science.1228026

A Reconstruction of Regional and Global Temperature for the Past 11,300 Years

Shaun A. Marcott, Jeremy D. Shakun, Peter U. Clark, Alan C. Mix

Surface temperature reconstructions of the past 1500 years suggest that recent warming is unprecedented in that time. Here we provide a broader perspective by reconstructing regional and global temperature anomalies for the past 11,300 years from 73 globally distributed records. Early Holocene (10,000 to 5000 years ago) warmth is followed by ~0.7°C cooling through the middle to late Holocene (<5000 years ago), culminating in the coolest temperatures of the Holocene during the Little Ice Age, about 200 years ago. This cooling is largely associated with ~2°C change in the North Atlantic. Current global temperatures of the past decade have not yet exceeded peak interglacial values but are warmer than during ~75% of the Holocene temperature history. Intergovernmental Panel on Climate Change model projections for 2100 exceed the full distribution of Holocene temperature under all plausible greenhouse gas emission scenarios.

Science

Marcott et al., 2012 is behind a paywall; however the supplementary materials include a link to their proxy data.

This paper appears to be a text book example of creating a Hockey Stick by using a low resolution time series for the handle and a high resolution time series for the blade…

Let’s test one of the 73 proxies.

I picked ODP-1019D, a marine sediment core from just offshore of the California-Oregon border because it has a long time series, is a an annual reconstruction and has a nearby long time series instrumental record (Grants Pass OR).

ODP-1019D has a resolution of 140 years. Grants Pass is annually resolved…

Let’s filter Grants Pass down to the resolution of the Marcott et al. reconstruction…

Grants Pass sure looks very anomalous relative to the rest of the Holocene… Right?

Well, not so fast. ODP1019D only has a 140-yr resolution. The record length at Grants Pass is less than 140 years. So, the entire Grants Pass record would be a single data point in the ODP-1019D record…

While, the most recent ~140 years might be warmer than most of the rest of the Holocene in this particular area, does anyone else notice what I did?

The Grants Pass/ODP-1019D area has been warming at a fairly steady rate for 6,500 years…

I don’t know how many of these proxies I will have time to analyze… Probably not very many. Maybe this could become a WUWT crowd-sourcing project.

“A [Junk] Scientist’s Misguided Crusade” Against Keystone XL

March 5, 2013

More improper activity from the Million Dollar Bureaucrat

A Scientist’s Misguided Crusade

By JOE NOCERA
Published: March 4, 2013

Last Friday, at 3:40 p.m., the State Department released its “Draft Supplemental Environmental Impact Statement” for the highly contentious Keystone XL pipeline, which Canada hopes to build to move its tar sands oil to refineries in the United States. In effect, the statement said there were no environmental impediments that would prevent President Obama from approving the pipeline.

Two hours and 20 minutes later, I received a blast e-mail containing a statement by James Hansen, the head of the Goddard Institute for Space Studies at NASA — i.e., NASA’s chief climate scientist. “Keystone XL, if the public were to allow our well-oiled government to shepherd it into existence, would be the first step down the wrong road, perpetuating our addiction to dirty fossil fuels, moving to ever dirtier ones,” it began. After claiming that the carbon in the tar sands “exceeds that in all oil burned in human history,” Hansen’s statement concluded: “The public must demand that the government begin serving the public’s interest, not the fossil fuel industry’s interest.”

As a private citizen, Hansen, 71, has the same First Amendment rights as everyone else. He can publicly oppose the Keystone XL pipeline if he so chooses, just as he can be as politically active as he wants to be in the anti-Keystone movement, and even be arrested during protests, something he managed to do recently in front of the White House.

But the blast e-mail didn’t come from James Hansen, private citizen. It specifically identified Hansen as the head of the Goddard Institute

[…]

Yet what people hear from Hansen today is not so much his science but his broad, unscientific views on, say, the evils of oil companies.

[…]

For a midlevel scientist at the Goddard Institute, what signal is Hansen sending when he takes the day off to get arrested at the White House? Do his colleagues feel unfettered in their own work? There is, in fact, enormous resentment toward Hansen inside NASA, where many officials feel that their solid, analytical work on climate science is being lost in what many of them describe as “the Hansen sideshow.”

[…]

NYT OpEd

Hansen should be fired and prosecuted for misusing his office and title as a NASA director in an effort to push his political agenda (the Hatch Act).

The Hatch Act grew out of nineteenth-century concerns about the political activities of federal employees. As early as 1801, President Thomas Jefferson issued an Executive Order that said federal workers should neither “influence the votes of others, nor take part in the business of electioneering.” He saw such activities as “inconsistent with the spirit of the Constitution.” Jefferson was primarily concerned with what government employees did while in office; subsequently, concerns developed in another area. Throughout the nineteenth century, appointments to the federal bureaucracy were viewed as the natural spoils of political success. The prevalent awarding of jobs for political loyalty created a so-called spoils system and, ultimately, a reaction against it.


LINK

Global Warming to Endanger Breakfast by 2080!!!

February 27, 2013

First it was wheat and now it’s coffee.  What’s next? Bacon & eggs?

This is nothing but alarmist nonsense…

Researchers at the Royal Botanic Gardens in Kew and the Environment and Coffee Forest Forum in Addis Ababa, Ethiopia looked at how climate change might make some land unsuitable for Arabica plants, which are highly vulnerable to temperature change and other dangers including pests and disease.

They came up with a best-case scenario that predicts a 38 per cent reduction in land capable of yielding Arabica by 2080. The worst-case scenario puts the loss at between 90 per cent and 100 per cent.

If global climate warming change disruption is likely to wipe out the most prevalent coffee bean in a few decades, the previous few hundred years of warming should have “left a mark” on global coffee production… Right?

I downloaded the latest HadCRUT4 temperature and Mauna Loa CO2 data from Wood for Trees and global coffee bean production from FAOSTAT and it appears that coffee bean trees like warmer temperatures…

And they really like a carbon dioxide-rich diet…

The “how climate change might make some land unsuitable” model was built from the IPCC’s totally bogus emissions scenarios. The modeled scenarios A1B, A2A and B2A.

The models say that “business as usual” will lead to A1-type scenarios (turn Earth into Venus and wipe out coffee). The models say that drastic cuts in carbon emissions are required to stay in the B2-type scenario range.

The actual data indicate that the B2-type scenario is the worst case possibility if we keep “business as usual”. 

Furthermore, HadCRUT4 shows absolutely no global warming since late 2000…

Now, if I take HadCRUT4 back to the beginning of 1997, I get this…

(Note: I built this graph back in November.)

Let’s look at the equation of the trend line:

y = 0.0048x – 9.2567

The key part of the equation is the number right before “x.” That’s what’s called the “slope” of the function. The slope is 0.0048 °C per year. This works out to about half-a-degree (0.5 °C) Celsius per century. For reference purposes, the IPCC “forecasted” 1.8 to 4.0 °C per century over the next 100 years, depending on their various socioeconomic scenarios. Here’s the real kicker… The IPCC “forecasted” 0.6 °C of warming over the next century in a scenario in which CO2 remains at the same level as it was in 2000. This is reminiscent of Hanson’s failed 1988 model. The IPCC forecast more warming in a steady-state CO2 world than has actually occurred since 1997.

Now let’s look at the “R²” value…

R² = 0.0334

R² is the “coefficient of determination.” It tells us how well the trend line fits the data. An R² of 1.0 would be a perfect fit. An R² of 0.0 would be no fit. 0.0334 is a lot closer to 0.0 than it is to 1.0. R² is related to explained variance. The linear trend line “explains” about 3.3% of the variation in the temperature data since 1997. 96.7% of the variation was due to natural climatic oscillations (quasi-periodic fluctuations, if you prefer) and stochastic variability.

The scenarios in which coffee beans *might* be threatened, “forecasted” 1.8 to 4.0 °C of warming in the 21st century based on “business as usual” carbon emissions. The actual warming since 1998 has been less than the scenario in which atmospheric CO2 levels stopped rising at the beginning of this century.

Data Sources:

Food and Agriculture Organization of the United Nations, FAO Statistics Division.  Coffee bean data downloaded on Feb. 27, 2013.

Hadley Centre.  HadCRUT4 tropical temperature data downloaded on February 27, 2013 from Wood for Trees.

NOAA Earth System Research Laboratory.  Mauna Loa CO2 data downloaded on February 27, 2013 from Wood for Trees.

Is Yoko Ono smarter than a 4th grader?

January 14, 2013

First up: Yoko Ono and friends…

‘Fracking kills’: Yoko Ono joins star-studded cast fighting against hydraulic natural gas drilling in upstate New York

John Lennon’s son Sean Lennon, actress Debra Winger, songstress Natalie Merchant and “The Avengers” actor Mark Ruffalo have also spoken out in opposition to the extraction process criticized for potentially contaminating water supplies and damaging the environment.

By Glenn Blain / NEW YORK DAILY NEWS
Published: Friday, January 11, 2013

ALBANY — Hydrofracking is not the most glamorous of issues but the gritty subject is bringing a lot of glitz to the state Capitol.

Yoko Ono, the widow of ex-Beatle John Lennon, and son Sean Lennon became the latest celebrities to visit Albany Friday to press for a ban on the controversial natural gas drilling.

“Fracking kills,” Ono said at a press conference with other drilling opponents. “And it doesn’t just kill us, it kills the land, nature and eventually the whole world.”

[…]

NY Daily News

Now it’s the 4th graders’ turn…

Fourth-graders have concluded fracking’s bad

By Steve Israel
Published: 2:00 AM – 01/13/13
If it were up to nearly four dozen future voters at a Middletown elementary school, fracking would be banned in New York — and the rest of the world.

Just listen to what those fourth-graders at Maple Hill Elementary School have to say about the controversial natural gas extraction method of hydraulic fracturing, or fracking:

“It could cause methane explosions, poison water and kill people. It killed cattle,” says 9-year-old Philip Gazer.

“Sometimes, because of fracking, earthquakes could happen,” says 9-year-old Sagnik Chakraborty, citing minor earthquakes in Ohio apparently caused by the underground injection of fracking waste.

Bottom line for the fourth-graders in the classes of Mary Hayes and Patricia McGorry?

“We don’t want to be poisoned by fracking,” says 11-year-old Nancy Jaime.

[…]

Recordonline


There you have it.  Yoko Ono is either not smarter than a 4th grader or she has a strong desire to spend winters freezing in the dark.    The wellhead price for natural gas in the US is currently in the range of $3.00 to $3.50/mcf.

The shale boom is the single biggest reason why natural gas prices are so low in the USA compared to most of the rest of the world…

Without fracking, there would be no shale boom and US natural gas prices could be $8/mcf or higher.

Election Day 2012: An ill wind blew and the fat man sang!

November 8, 2012

This post of Anthony’s inspired to compose this graphical illustration of how “an ill wind blew and the fat man sang”…

Figure 1. Post-Tropical Cyclone Sandy Storm Track Map (NOAA/NWS), President Obama & Gov. Christie (Washington Post), Fox News Exit Poll (WUWT), RCP Poll Average (Real Clear Politics) and Sandy’s landfall (CIMSS/Univ. Wisconsin-Madison/NASA/NOAA via WUWT).

Acting like the president for four days out of the last four years turned the tide… And a good Envirostatist never lets a “serious crisis to go to waste”…

America’s Choice 2012

Climate change is back on the table
By Steve Hargreaves @CNNMoney November 7, 2012

NEW YORK (CNNMoney) — Climate change is once again a hot topic in the Untied States.

Hurricane Sandy brought the issue back into the spotlight just days before the presidential election. Pundits were quick to note the irony of a massive superstorm striking after three presidential debates that didn’t mention climate change once.

After the storm, New York Mayor Michael Bloomberg evoked the issue again, pointing to climate change specifically in an unexpected, last-minute endorsement of President Obama.

And if there was any lingering doubt about the issue being back in the limelight, the president dispelled it Tuesday night by mentioning global warming in his acceptance speech alongside other priorities like budget and tax reform.

“We want our children to live in an America that isn’t burdened by debt, that isn’t weakened by inequality, that isn’t threatened by the destructive power of a warming planet,” he said.

[…]

CNN Money

Never minding the fact that extra-tropical cyclone Sandy was anything but unprecedented; nor was it the new normal, the storm and President Obama’s appearance of competence were apparently enough to sway about 3% of the electorate. So, no doubt, Mr. Obama and his merry band of Envirostatists will be repeating this page from their playbook…


Election Day 2012: An ill wind blew and the fat man sang!